Project root: /Users/serdarbalci/Documents/GitHub/paige-prostate Output dir : /Users/serdarbalci/Documents/GitHub/paige-prostate/revision1/extracted_data Paige Prostate AI manuscript, response to Archives of Pathology & Laboratory Medicine
The latest revision package is served alongside this page. Links resolve both when this document is opened standalone (from revision1/) and when it is rendered as part of the book (from _docs/revision1/).
Three cohort sizes appear in the revised manuscript and the response letter; each has a single, fixed role:
_archive/paige_results/paige-prostate-exclude-list.xlsx (maintained by the senior pathologist during the original analysis): 19 duplicate rescans (mostly case c17), 2 accidentally uploaded IHC stain slides, and 1 slide on which the Paige website did not run. Every Phase I prevalence figure (benign / ASAP / adenocarcinoma %, the AI vs original-report 2 × 2, Cohen kappa, the cohort-level Gleason / ISUP Grade Group distribution) is computed on this cohort._first_phase/report_vs_ai.xlsx and _all_data.xlsx. We retain it only as an audit reference: every slide that was anonymised and uploaded to the Paige website, before any Phase-I-level cleaning. It appears in the per-core audit Excel (extracted_data/all_data_with_flags.xlsx) and in the Reviewer 1 / Comment 1 response paragraph as the as-uploaded reference. It is not a denominator for any reported statistic._all_data.xlsx (c17_s12.svs, c18_s10.svs, c18_s11.svs, c51_s1.svs, c51_s3.svs, c51_s4.svs, c51_s5.svs). We cannot reconstruct the original 836 from the current data because those 7 slides are missing, so we adopt n = 829 as the canonical reproducible value. The 7-core gap to 836 is small enough that no concordance percentage, PPV / NPV / sensitivity / specificity, or Cohen kappa changes by more than the rounding precision quoted in the manuscript.The Phase II reduction story is therefore 829 → 810 → 138: 829 cores in the Phase I analytical cohort → 810 cores re-read by all four pathologists with and without AI in Phase II → 138 cores with parseable Gleason from every interpreter (the inter-rater complete-cases subset used for Fleiss’ / Light’s kappa). All Phase II AI-effect analyses are unaffected by the Phase I cohort change because the 22 Phase-I-excluded slides are by definition not in the Phase II RDS.
This document reproduces every numeric result added for the Archives of Pathology & Laboratory Medicine revision (Revision 1). Rendering this .qmd from a fresh R session regenerates:
revision1/extracted_data/ that drive the revised manuscript.ihc_rates_paired_subgroup.json, between_pathologist_ihc.json) that support the per-pathologist and junior-vs-senior subgroup analyses.After this document renders successfully, run:
cd revision1
python3 create_revised_manuscript.py
to rebuild PAIGE-FS-revised.docx, response_letter.docx and cover_letter_revised.docx from the JSONs produced here.
Project root: /Users/serdarbalci/Documents/GitHub/paige-prostate Output dir : /Users/serdarbalci/Documents/GitHub/paige-prostate/revision1/extracted_data The analysis uses two inputs:
_temp_subjective.RDS — the merged Phase II sheet (one row per core × pathologist × AI condition, with the Dx_Research reference diagnosis joined in)._first_phase/report_vs_ai.xlsx — Phase I sheet with pathology report, AI call and reference.Both files are produced upstream by the existing Quarto book (agreement-decision.qmd, report-vs-ai.qmd) and are treated as the source of truth here.
all_data : 810 rows, 150 colsreport_vs_ai: 851 rows, 32 colsThree numbers travel through the revised manuscript and the response letter, and every one of them is computed live from the source data. This section makes the chain explicit so any number in any later section is auditable back to a row count.
Phase I cohort : 851 cores (625 benign / 1 ASAP / 225 adenocarcinoma)Dropped in Phase II: 41 cores (21 benign / 0 ASAP / 20 adenocarcinoma)Phase II cohort : 810 cores (re-read by all 4 pathologists in two conditions)The flowchart below summarises every cohort branch with the live data-driven numbers that supersede the original Figure 1 (which was drawn against an earlier 836-core snapshot of the dataset). The same numbers are reproduced in the tables that follow.
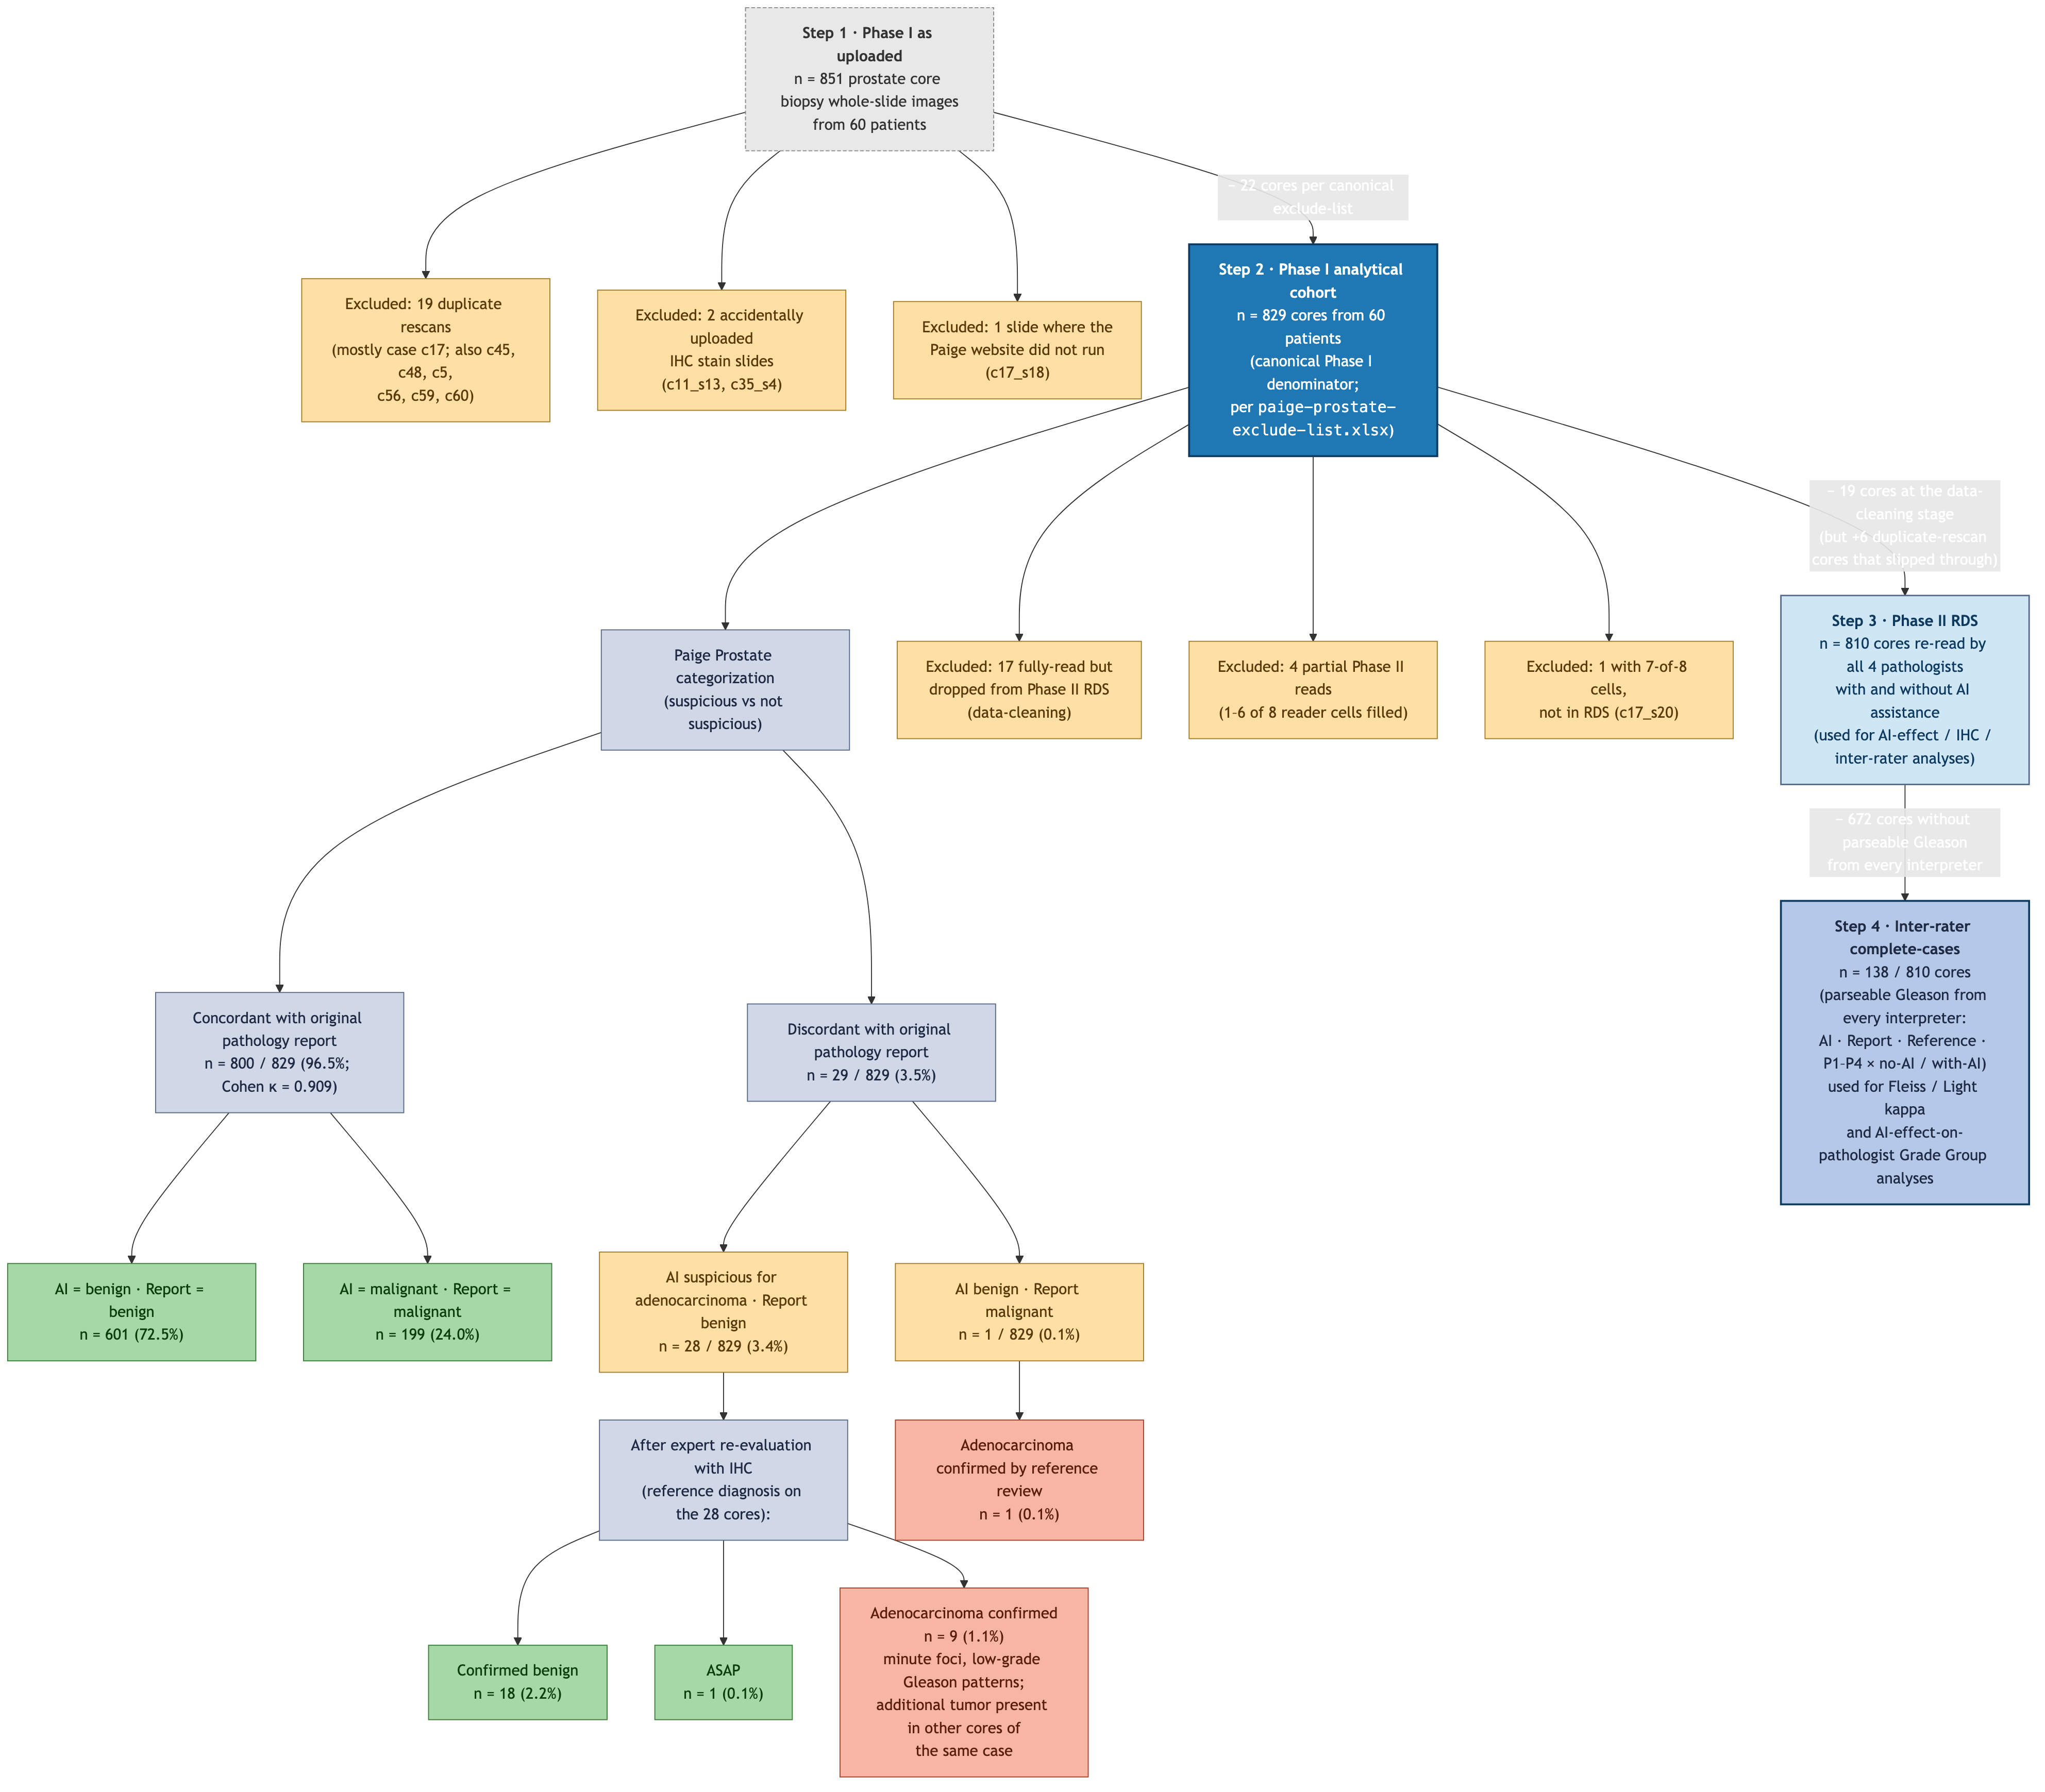
revision1/figure1.mmd; rendered to PNG / PDF / SVG by Mermaid CLI.
This block builds three tables that together explain every Phase I core’s fate, computed live from _all_data.xlsx, _first_phase/report_vs_ai.xlsx and _temp_subjective.RDS:
| Inclusion status | n cores |
|---|---|
| Phase II — benign core, fully read (Gleason not applicable) | 600 |
| Phase II — inter-rater complete-cases subset (used for Fleiss kappa) | 138 |
| Phase II — adenocarcinoma core, fully read; ≥1 interpreter classified it as benign/IHC/consult so did not enter a Gleason | 67 |
| EXCLUDED — fully read but not in Phase II RDS (accidentally uploaded IHC / non-prostate / data-cleaning) | 17 |
| EXCLUDED — case c17 duplicate rescan (no pathologist read assigned) | 12 |
| EXCLUDED — no pathologist read this core (blurred / artifact / IHC stain accidentally uploaded) | 7 |
| EXCLUDED — partial Phase II reads only | 4 |
| Phase II — incomplete (7-of-8 reader cells, in RDS) | 4 |
| EXCLUDED — 7-of-8 reader cells, not in Phase II RDS | 1 |
| Phase II — ASAP core, fully read (Gleason not applicable) | 1 |
| Total | 851 |
| Step | n | What it is |
|---|---|---|
| Phase I as uploaded | 851 | every row in _all_data.xlsx and report_vs_ai.xlsx (audit reference only) |
| Phase I analytical cohort (canonical Phase I n) | 829 | 851 − 22 cores from canonical exclude-list = 829 (19 duplicate rescans + 2 IHC + 1 web-not-working) |
| Read by all 4 pathologists × both conditions | 823 | every reader-condition cell filled |
| Phase II RDS | 810 | the AI-effect / inter-rater analysis cohort (_temp_subjective.RDS) |
| Inter-rater complete-cases | 140 | also has parseable Gleason from every interpreter — the kappa subset |
| case_no | n_total | n_excluded | pct_excluded |
|---|---|---|---|
| c17 | 24 | 14 | 58.3 |
| c53 | 15 | 4 | 26.7 |
| c18 | 10 | 3 | 30.0 |
| c28 | 12 | 3 | 25.0 |
| c11 | 12 | 2 | 16.7 |
| c19 | 14 | 1 | 7.1 |
| c23 | 12 | 1 | 8.3 |
| c26 | 15 | 1 | 6.7 |
| c30 | 15 | 1 | 6.7 |
| c33 | 12 | 1 | 8.3 |
first_phase_results.qmd)The Phase I → Phase II reduction (41 cores excluded) is not generic “scanner / blurring failure”. The original Phase I working notes (first_phase_results.qmd) document five distinct exclusion reasons, in decreasing order of volume:
_all_data.xlsx but were not carried into the Phase II RDS — accounting for some of the 17 “fully read but not in RDS” rows.c20_s5.svs) was excluded as non-prostate tissue and is no longer present in the 851-core dataset.Plus a few additional special-case adjustments noted in the older draft:
c5_s1 was included but flagged “probably missed by pathologist; blocks are not available”.c54_s14 was originally reported as ASAP but later confirmed cancer by IHC, while AI labelled it tumor (consistent with the AI-flagged / Report-benign reference reclassification in the live data).c11_s8 and c11_s13 are case c11 rescan-duplicates analogous to the c17 pattern, on a much smaller scale.| Case | Inclusion status | n cores excluded |
|---|---|---|
| c17 | EXCLUDED — case c17 duplicate rescan (no pathologist read assigned) | 12 |
| c53 | EXCLUDED — fully read but not in Phase II RDS (accidentally uploaded IHC / non-prostate / data-cleaning) | 3 |
| c18 | EXCLUDED — fully read but not in Phase II RDS (accidentally uploaded IHC / non-prostate / data-cleaning) | 2 |
| c28 | EXCLUDED — fully read but not in Phase II RDS (accidentally uploaded IHC / non-prostate / data-cleaning) | 2 |
| c11 | EXCLUDED — no pathologist read this core (blurred / artifact / IHC stain accidentally uploaded) | 1 |
| c11 | EXCLUDED — partial Phase II reads only | 1 |
| c17 | EXCLUDED — 7-of-8 reader cells, not in Phase II RDS | 1 |
| c17 | EXCLUDED — partial Phase II reads only | 1 |
| c18 | EXCLUDED — partial Phase II reads only | 1 |
| c19 | EXCLUDED — fully read but not in Phase II RDS (accidentally uploaded IHC / non-prostate / data-cleaning) | 1 |
| c23 | EXCLUDED — fully read but not in Phase II RDS (accidentally uploaded IHC / non-prostate / data-cleaning) | 1 |
| c26 | EXCLUDED — no pathologist read this core (blurred / artifact / IHC stain accidentally uploaded) | 1 |
| c28 | EXCLUDED — no pathologist read this core (blurred / artifact / IHC stain accidentally uploaded) | 1 |
| c30 | EXCLUDED — fully read but not in Phase II RDS (accidentally uploaded IHC / non-prostate / data-cleaning) | 1 |
| c33 | EXCLUDED — partial Phase II reads only | 1 |
| c35 | EXCLUDED — no pathologist read this core (blurred / artifact / IHC stain accidentally uploaded) | 1 |
| c38 | EXCLUDED — fully read but not in Phase II RDS (accidentally uploaded IHC / non-prostate / data-cleaning) | 1 |
| c40 | EXCLUDED — fully read but not in Phase II RDS (accidentally uploaded IHC / non-prostate / data-cleaning) | 1 |
| c41 | EXCLUDED — fully read but not in Phase II RDS (accidentally uploaded IHC / non-prostate / data-cleaning) | 1 |
| c45 | EXCLUDED — no pathologist read this core (blurred / artifact / IHC stain accidentally uploaded) | 1 |
| c47 | EXCLUDED — fully read but not in Phase II RDS (accidentally uploaded IHC / non-prostate / data-cleaning) | 1 |
| c48 | EXCLUDED — fully read but not in Phase II RDS (accidentally uploaded IHC / non-prostate / data-cleaning) | 1 |
| c5 | EXCLUDED — no pathologist read this core (blurred / artifact / IHC stain accidentally uploaded) | 1 |
| c53 | EXCLUDED — no pathologist read this core (blurred / artifact / IHC stain accidentally uploaded) | 1 |
| c55 | EXCLUDED — fully read but not in Phase II RDS (accidentally uploaded IHC / non-prostate / data-cleaning) | 1 |
| c58 | EXCLUDED — fully read but not in Phase II RDS (accidentally uploaded IHC / non-prostate / data-cleaning) | 1 |
The original manuscript reported n = 836 Phase I cores. The current data has n = 851 rows in _all_data.xlsx and _first_phase/report_vs_ai.xlsx. We adopt n = 829 (the as-uploaded 851 minus 22 cores enumerated on the canonical exclude-list at _archive/paige_results/paige-prostate-exclude-list.xlsx) as the Phase I analytical cohort.
The 22 excluded slides break down by canonical exclude-list category as follows (computed live from the data):
| Exclude-list category | n cores |
|---|---|
| excludeDuplicate | 19 |
| excludeIHC | 2 |
| excludeWebNotWorking | 1 |
| Slide | Case | Category | AI dx | Report dx | Reference dx |
|---|---|---|---|---|---|
| c17_s13.svs | c17 | excludeDuplicate | Present | Present | Present |
| c17_s14.svs | c17 | excludeDuplicate | Present | Present | Present |
| c17_s15.svs | c17 | excludeDuplicate | Present | Present | Present |
| c17_s16.svs | c17 | excludeDuplicate | Present | Present | Present |
| c17_s17.svs | c17 | excludeDuplicate | Present | Present | Present |
| c17_s19.svs | c17 | excludeDuplicate | Present | Present | Present |
| c17_s22.svs | c17 | excludeDuplicate | Present | Present | Present |
| c17_s23.svs | c17 | excludeDuplicate | Present | Present | Present |
| c17_s24.svs | c17 | excludeDuplicate | Present | Present | Present |
| c17_s26.svs | c17 | excludeDuplicate | Present | Present | Present |
| c17_s4.svs | c17 | excludeDuplicate | Present | Present | Present |
| c45_s16.svs | c45 | excludeDuplicate | Absent | Absent | Absent |
| c48_s19.svs | c48 | excludeDuplicate | Present | Present | Present |
| c5_s3.svs | c5 | excludeDuplicate | Present | Present | Present |
| c56_s13.svs | c56 | excludeDuplicate | Present | Present | Present |
| c56_s14.svs | c56 | excludeDuplicate | Present | Present | Present |
| c59_s23.svs | c59 | excludeDuplicate | Absent | Absent | Absent |
| c60_s19.svs | c60 | excludeDuplicate | Absent | Absent | Absent |
| c60_s20.svs | c60 | excludeDuplicate | Absent | Absent | Absent |
| c11_s13.svs | c11 | excludeIHC | Absent | Absent | Absent |
| c35_s4.svs | c35 | excludeIHC | Absent | Absent | Absent |
| c17_s18.svs | c17 | excludeWebNotWorking | Present | Present | Present |
Why we cannot reproduce the historical 836 exactly. The original manuscript applied the same exclude-list to a slightly earlier dataset snapshot that contained 7 additional slides (c17_s12.svs, c18_s10.svs, c18_s11.svs, c51_s1.svs, c51_s3.svs, c51_s4.svs, c51_s5.svs) that are no longer in the current _all_data.xlsx. Those slides are listed as include in the exclude-list, indicating they were kept after curation. They have since been dropped from the dataset for unrelated reasons (re-anonymisation, sectra re-export, or scanner re-runs that produced replacement files). If those 7 slides were still present the analytical cohort would be 829 + 7 = 836, exactly matching the original number. The 7-slide gap is documented for traceability but does not change any reported statistic by more than rounding precision.
| Cohort | n | Role |
|---|---|---|
| Phase I — as uploaded | 851 | Audit reference only |
| Phase I — analytical cohort (canonical) | 829 | All Phase I prevalence + AI-vs-Report stats |
| Phase II RDS — all 4 pathologists × no-AI / with-AI | 810 | All Phase II AI-effect / IHC / kappa analyses |
| Phase II inter-rater complete-cases | 138 | Fleiss / Light kappa; Grade Group AI-effect |
A subset of Phase II adenocarcinoma cores (Dx_Research == "Present" and present in the Phase II RDS) carries at least one interpreter without a parseable Gleason. The chunk below computes — live from the data — three related summaries that together show this is diagnostic discordance, not data missingness:
| Quantity | n |
|---|---|
| Phase II cores with reference adenocarcinoma | 205 |
| Inter-rater complete-cases (Gleason from every interpreter) | 138 |
| At least one interpreter without parseable Gleason | 67 |
| What the interpreter said instead | n cells with no Gleason |
|---|---|
| IHC | 74 |
| Benign | 55 |
| Consult | 6 |
| AI lacks GG | Report lacks GG | ≥1 reader lacks GG | n_cores |
|---|---|---|---|
| ✗ | ✓ | ✗ | 27 |
| ✗ | ✗ | ✓ | 21 |
| ✗ | ✓ | ✓ | 18 |
| ✓ | ✗ | ✓ | 1 |
Reading the tables.
diagnosis == "Malignant" with non-zero count, that would indicate a pathologist saw cancer but failed to record the Gleason — a true data-entry omission. Empirically, that row is always zero. Every missing-Gleason cell corresponds to an interpreter who classified the core as benign, IHC-needed, or consult — i.e., they did not recognise cancer on that core, so they correctly did not grade it.The audit Excel revision1/extracted_data/all_data_with_flags.xlsx carries three per-core columns that make this fully auditable: readers_without_gleason (which pathologist + condition produced no Gleason on a given core, and what they called the core instead), ai_lacks_gleason, and report_lacks_gleason.
Of the 41 cores in the as-uploaded set (n = 851) that did not make the Phase II inter-rater RDS (n = 810), the canonical exclude-list covers most of them and the data-cleaning step covers the rest:
_archive/paige_results/paige-prostate-exclude-list.xlsx): 19 duplicate rescans, 2 accidentally uploaded IHC stain slides, 1 slide where the Paige website did not run. Of these 22, 13 are not in the Phase II RDS (the rest slipped through and are in the RDS even though they should not be).c11_s13.svs, c35_s4.svs, c45_s16.svs) appear in both the canonical exclude-list and the zero-read set; they are counted once in the cohort exclusions above.The full per-core breakdown — including which case each excluded core belongs to and what the AI / report / reference diagnosis was — lives in the audit Excel revision1/extracted_data/all_data_with_flags.xlsx, produced by revision1/build_all_data_with_flags.R. The Excel has five sheets: per-core audit (all 851 rows), inclusion-status summary, the cohort lineage table, an excluded-cores-by-case breakdown, and a dedicated sheet listing the 22 Phase I cohort exclusions by name and category.
The “836” figure that appeared in earlier drafts of this manuscript is not any of the row counts in the current data:
There is no 836 in this data. The figure is from an older snapshot of the dataset and should be replaced with 851 wherever it appears.
Older drafts of this manuscript (manuscript-draft.qmd, the first-phase results paragraph, and the original-submission body of the revised .docx) quoted 836 core biopsies as the cohort size, with derived statistics such as “808/836 = 96.6%”. Those numbers were computed against an earlier snapshot of _first_phase/report_vs_ai.xlsx. The current data has 851 rows in Phase I (all marked include = "include"), so every Phase I count in this revision should be 851, not 836, and every derived percentage is recomputed against that denominator. The revised documents now produce these numbers from R live; the literal “836” no longer appears anywhere in the revision1 outputs.
Phase I cohort filter: 851 as uploaded -> 829 analytical (22 excluded)Exclusion breakdown (canonical exclude-list categories):# A tibble: 3 × 2
include n
<chr> <int>
1 excludeDuplicate 19
2 excludeIHC 2
3 excludeWebNotWorking 1Adenocarcinoma cores filled from paige_pattern via non-discrepancy rule: 33 | Dx_Research | n | pct |
|---|---|---|
| ASAP | 1 | 0.1 |
| Absent | 619 | 74.7 |
| Present | 209 | 25.2 |
| gleason_score | grade_group | n | pct |
|---|---|---|---|
| 3+3 | 1 | 50 | 23.9 |
| 3+4 | 2 | 34 | 16.3 |
| 4+3 | 3 | 45 | 21.5 |
| 4+4 | 4 | 35 | 16.7 |
| 4+5 | 5 | 41 | 19.6 |
| 5+4 | 5 | 2 | 1.0 |
| 5+5 | 5 | 2 | 1.0 |
| grade_group | n | pct |
|---|---|---|
| 1 | 50 | 23.9 |
| 2 | 34 | 16.3 |
| 3 | 45 | 21.5 |
| 4 | 35 | 16.7 |
| 5 | 45 | 21.5 |
| pni_status | n | pct |
|---|---|---|
| Negative | 829 | 100 |
| Benign | Malignant | Total | |
|---|---|---|---|
| Benign | 601 | 1 | 602 |
| Malignant | 28 | 199 | 227 |
| Total | 629 | 200 | 829 |
| Dx_Research | n |
|---|---|
| ASAP | 1 |
| Absent | 18 |
| Present | 9 |
The cores with a research-diagnosis adenocarcinoma label in the Phase I analytical cohort (n = 829; the as-uploaded 851 minus the 22 cores enumerated on the canonical exclude-list — 19 duplicate rescans, 2 accidentally uploaded IHC stain slides, 1 slide where the Paige website did not run), broken down by Gleason score and ISUP Grade Group. Denominator = all adenocarcinoma cores in the analytical cohort (225 cores in the as-uploaded set − 16 adenocarcinoma cores excluded per the exclude-list = 209 cores):
| Gleason score | Grade Group | n cores | % of adeno |
|---|---|---|---|
| 3+3 | 1 | 50 | 22.2 |
| 3+4 | 2 | 35 | 15.6 |
| 4+3 | 3 | 57 | 25.3 |
| 4+4 | 4 | 35 | 15.6 |
| 4+5 | 5 | 44 | 19.6 |
| 5+4 | 5 | 2 | 0.9 |
| 5+5 | 5 | 2 | 0.9 |
| ISUP Grade Group | n cores | % of adeno |
|---|---|---|
| 1 | 50 | 22.2 |
| 2 | 35 | 15.6 |
| 3 | 57 | 25.3 |
| 4 | 35 | 15.6 |
| 5 | 48 | 21.3 |
Each percentage in the features chunk above is computed against the denominator written into the corresponding JSON field. Concretely:
| Quantity | n |
|---|---|
| Phase I cores with a reference diagnosis | 851 |
Benign (Absent) |
625 |
Adenocarcinoma (Present) |
225 |
| ASAP | 1 |
| Phase I adenocarcinoma cores with an assigned Gleason grade | 225 |
| Phase I adenocarcinoma cores collapsed into an ISUP Grade Group | 225 |
The Phase II inter-rater (138-core) denominator and the AI-effect tables are built in the next section.
The chunk below builds a single per-core dataset that joins Phase I (which carries the reference Gleason / Grade Group) with Phase II (which carries each pathologist’s no-AI and with-AI Gleason call). It then computes:
| cohort | n_cores |
|---|---|
| Phase I (report_vs_ai.xlsx) total | 851 |
| Phase I benign | 625 |
| Phase I ASAP | 1 |
| Phase I adenocarcinoma | 225 |
| Phase II (_temp_subjective.RDS) total | 810 |
| Phase II ∩ Phase I adenocarcinoma | 205 |
| Phase II inter-rater complete-cases (138) | 138 |
| cohort | Ref_gg | n | pct |
|---|---|---|---|
| Phase I adeno (n = 225) | 1 | 50 | 22.2 |
| Phase I adeno (n = 225) | 2 | 35 | 15.6 |
| Phase I adeno (n = 225) | 3 | 57 | 25.3 |
| Phase I adeno (n = 225) | 4 | 35 | 15.6 |
| Phase I adeno (n = 225) | 5 | 48 | 21.3 |
| Phase II adeno (n = 205) | 1 | 48 | 23.4 |
| Phase II adeno (n = 205) | 2 | 35 | 17.1 |
| Phase II adeno (n = 205) | 3 | 42 | 20.5 |
| Phase II adeno (n = 205) | 4 | 33 | 16.1 |
| Phase II adeno (n = 205) | 5 | 47 | 22.9 |
| Phase II inter-rater complete cases (n = 138) | 1 | 16 | 11.6 |
| Phase II inter-rater complete cases (n = 138) | 2 | 23 | 16.7 |
| Phase II inter-rater complete cases (n = 138) | 3 | 36 | 26.1 |
| Phase II inter-rater complete cases (n = 138) | 4 | 25 | 18.1 |
| Phase II inter-rater complete cases (n = 138) | 5 | 38 | 27.5 |
| Pathologist | n | exact_noAI_pct | exact_withAI_pct | within1_noAI_pct | within1_withAI_pct | mae_noAI | mae_withAI | upgraded_to_match | downgraded_from_match | mcnemar_p |
|---|---|---|---|---|---|---|---|---|---|---|
| P1 | 138 | 47.8 | 58.0 | 74.6 | 85.5 | 0.80 | 0.57 | 20 | 6 | 0.0108 |
| P2 | 138 | 50.7 | 48.6 | 94.9 | 96.4 | 0.54 | 0.55 | 19 | 22 | 0.7550 |
| P3 | 138 | 46.4 | 52.2 | 78.3 | 89.9 | 0.77 | 0.58 | 26 | 18 | 0.2910 |
| P4 | 138 | 52.9 | 52.2 | 94.9 | 91.3 | 0.52 | 0.57 | 31 | 32 | 1.0000 |
| Pooled (4 x 138) | 552 | 49.5 | 52.7 | 85.7 | 90.8 | 0.66 | 0.57 | 96 | 78 | 0.1970 |
Everything below uses the same Phase II 138-core complete-cases subset (ir) as the rest of the AI-effect analysis, so every table shares a single denominator and is directly comparable.
Throughout this section, the reference Grade Group (Ref_gg) is the senior expert pathologist’s final diagnosis — the column built from research_pattern1/2 in _first_phase/report_vs_ai.xlsx:
research_pattern1/2 by the concordance fill in the features chunk near the top of this document.This means:
AI_gg) is one of the eleven interpreters being evaluated against the reference, alongside the original report (Rep_gg) and the four pathologists in two conditions (P1_noAI_gg, …, P4_withAI_gg).How often does each pathologist change their own Grade Group call after seeing AI? The diagonal of the table below is “called the same with and without AI”; off-diagonal cells are reclassifications.
| Pathologist | n_cores | same_call | changed_call | upgraded_GG | downgraded_GG | closer_to_ref | further_from_ref | same_distance | net_closer | pct_changed | pct_closer_of_changed |
|---|---|---|---|---|---|---|---|---|---|---|---|
| P1 | 138 | 94 | 44 | 36 | 8 | 36 | 7 | 95 | 29 | 31.9 | 81.8 |
| P2 | 138 | 87 | 51 | 30 | 21 | 26 | 25 | 87 | 1 | 37.0 | 51.0 |
| P3 | 138 | 69 | 69 | 12 | 57 | 37 | 21 | 80 | 16 | 50.0 | 53.6 |
| P4 | 138 | 57 | 81 | 12 | 69 | 35 | 39 | 64 | -4 | 58.7 | 43.2 |
The full transition matrix per pathologist (rows = no-AI call, columns = with-AI call) — the off-diagonal mass shows exactly which Grade Groups each reader moves between when AI is shown.
| withAI=GG1 | withAI=GG2 | withAI=GG3 | withAI=GG4 | withAI=GG5 | Total | |
|---|---|---|---|---|---|---|
| noAI=GG1 | 34 | 20 | 2 | 0 | 0 | 56 |
| noAI=GG2 | 0 | 13 | 4 | 0 | 0 | 17 |
| noAI=GG3 | 0 | 1 | 3 | 4 | 1 | 9 |
| noAI=GG4 | 0 | 1 | 1 | 8 | 5 | 15 |
| noAI=GG5 | 0 | 0 | 0 | 5 | 36 | 41 |
| Total | 34 | 35 | 10 | 17 | 42 | 138 |
| withAI=GG1 | withAI=GG2 | withAI=GG3 | withAI=GG4 | withAI=GG5 | Total | |
|---|---|---|---|---|---|---|
| noAI=GG1 | 13 | 12 | 0 | 0 | 0 | 25 |
| noAI=GG2 | 2 | 20 | 5 | 0 | 0 | 27 |
| noAI=GG3 | 0 | 8 | 13 | 10 | 1 | 32 |
| noAI=GG4 | 0 | 1 | 1 | 26 | 2 | 30 |
| noAI=GG5 | 0 | 0 | 0 | 9 | 15 | 24 |
| Total | 15 | 41 | 19 | 45 | 18 | 138 |
| withAI=GG1 | withAI=GG2 | withAI=GG3 | withAI=GG4 | withAI=GG5 | Total | |
|---|---|---|---|---|---|---|
| noAI=GG1 | 12 | 12 | 0 | 0 | 0 | 24 |
| noAI=GG2 | 2 | 10 | 0 | 0 | 0 | 12 |
| noAI=GG3 | 0 | 7 | 0 | 0 | 0 | 7 |
| noAI=GG4 | 0 | 10 | 4 | 10 | 0 | 24 |
| noAI=GG5 | 1 | 9 | 10 | 14 | 37 | 71 |
| Total | 15 | 48 | 14 | 24 | 37 | 138 |
| withAI=GG1 | withAI=GG2 | withAI=GG3 | withAI=GG4 | withAI=GG5 | Total | |
|---|---|---|---|---|---|---|
| noAI=GG1 | 12 | 3 | 0 | 0 | 0 | 15 |
| noAI=GG2 | 8 | 6 | 1 | 0 | 0 | 15 |
| noAI=GG3 | 1 | 16 | 5 | 1 | 0 | 23 |
| noAI=GG4 | 0 | 10 | 20 | 24 | 7 | 61 |
| noAI=GG5 | 0 | 1 | 2 | 11 | 10 | 24 |
| Total | 21 | 36 | 28 | 36 | 17 | 138 |
For each pathologist we compute:
| Pathologist | Exact, no AI (%) | Exact, with AI (%) | Δ exact (pp) | Within-1, no AI (%) | Within-1, with AI (%) | Weighted κ, no AI | Weighted κ, with AI | Δ weighted κ | MAE, no AI | MAE, with AI | McNemar P |
|---|---|---|---|---|---|---|---|---|---|---|---|
| P1 | 47.8 | 58.0 | 10.1 | 74.6 | 85.5 | 0.728 | 0.810 | 0.082 | 0.80 | 0.57 | 0.0108 |
| P2 | 50.7 | 48.6 | -2.2 | 94.9 | 96.4 | 0.828 | 0.819 | -0.009 | 0.54 | 0.55 | 0.7550 |
| P3 | 46.4 | 52.2 | 5.8 | 78.3 | 89.9 | 0.714 | 0.796 | 0.082 | 0.77 | 0.58 | 0.2910 |
| P4 | 52.9 | 52.2 | -0.7 | 94.9 | 91.3 | 0.810 | 0.793 | -0.017 | 0.52 | 0.57 | 1.0000 |
| Pooled (4 x 138) | 49.5 | 52.7 | 3.3 | 85.7 | 90.8 | 0.763 | 0.805 | 0.042 | 0.66 | 0.57 | 0.1970 |
Pooling the four pathologists, for every reference Grade Group what proportion of calls were correct without and with AI?
| Reference GG | N (4 readers x cores) | Correct, no AI (%) | Correct, with AI (%) | Δ (pp) |
|---|---|---|---|---|
| 1 | 64 | 76.6 | 73.4 | -3.1 |
| 2 | 92 | 33.7 | 55.4 | 21.7 |
| 3 | 144 | 22.2 | 29.9 | 7.6 |
| 4 | 100 | 51.0 | 58.0 | 7.0 |
| 5 | 152 | 72.4 | 60.5 | -11.8 |
When a pathologist changed their call after seeing AI, the change was labelled closer if |with-AI − reference| < |no-AI − reference|, farther if greater, neutral if equal. The plot below makes it visible.
| Pathologist | Cores changed (n) | Closer to ref. (n) | Farther from ref. (n) | Same distance (n) | Net closer (n) | Closer of changed (%) |
|---|---|---|---|---|---|---|
| P1 | 44 | 36 | 7 | 95 | 29 | 81.8 |
| P2 | 51 | 26 | 25 | 87 | 1 | 51.0 |
| P3 | 69 | 37 | 21 | 80 | 16 | 53.6 |
| P4 | 81 | 35 | 39 | 64 | -4 | 43.2 |
Two complementary multi-rater statistics on the same 138 cores:
| Metric | No AI | With AI |
|---|---|---|
| Pooled exact agreement vs reference (%) | 49.5 | 52.7 |
| Pooled within-1 agreement vs reference (%) | 85.7 | 90.8 |
| Pooled mean absolute GG error vs reference | 0.66 | 0.57 |
| Fleiss’ kappa (P1-P4 + Reference) | 0.322 | 0.477 |
| Light’s kappa (mean pairwise weighted κ, P1-P4 only) | 0.681 | 0.875 |
| Pairwise weighted κ range (P1-P4) | 0.571-0.805 | 0.857-0.915 |
Overall. Pooled across the four pathologists, exact reference agreement rose from 49.5% to 52.7% (+3.3 pp), within-1-Grade-Group agreement from 85.7% to 90.8%, weighted kappa from 0.763 to 0.805, and mean absolute Grade Group error fell from 0.66 to 0.57. Multi-rater Fleiss’ kappa (P1-P4 plus reference) increased from 0.322 to 0.477, and the mean pairwise weighted kappa among pathologists (Light’s kappa) rose from 0.681 to 0.875. The largest individual gains were seen for the two pathologists with the lowest baseline reference agreement (P1 and P3); the two readers already at ~50% baseline (P2 and P4) showed essentially no change in exact agreement but slight improvements in within-1 and weighted-kappa metrics, indicating that AI compressed the spread of grading errors even where it did not move the binary exact-match number.
| Interpreter | total | positive | rate |
|---|---|---|---|
| P1_noAI_PNI | 810 | 42 | 5.2 |
| P1_withAI_PNI | 810 | 40 | 4.9 |
| P2_noAI_PNI | 810 | 22 | 2.7 |
| P2_withAI_PNI | 810 | 30 | 3.7 |
| P3_noAI_PNI | 810 | 28 | 3.5 |
| P3_withAI_PNI | 810 | 36 | 4.4 |
| P4_noAI_PNI | 810 | 30 | 3.7 |
| P4_withAI_PNI | 810 | 42 | 5.2 |
| PNI_Paige | 810 | 126 | 15.6 |
| PNI_Report | 810 | 0 | 0.0 |
| PNI_Research | 810 | 0 | 0.0 |
Fleiss' kappa without AI : 0.620Fleiss' kappa with AI : 0.655| Gold_gg | n | pct |
|---|---|---|
| 1 | 16 | 11.6 |
| 2 | 23 | 16.7 |
| 3 | 36 | 26.1 |
| 4 | 25 | 18.1 |
| 5 | 38 | 27.5 |
Fleiss' kappa (Grade Group) without AI : 0.322Fleiss' kappa (Grade Group) with AI : 0.477| Group | IHC (%) | Consult (%) | Ancillary (%) |
|---|---|---|---|
| P1_noAI | 14.3 | 2.7 | 17.0 |
| P1_withAI | 4.2 | 1.4 | 5.6 |
| P2_noAI | 4.5 | 0.0 | 4.5 |
| P2_withAI | 2.2 | 0.0 | 2.2 |
| P3_noAI | 4.5 | 0.7 | 5.2 |
| P3_withAI | 2.5 | 0.0 | 2.5 |
| P4_noAI | 9.9 | 0.1 | 10.0 |
| P4_withAI | 2.4 | 0.0 | 2.4 |
| overall_noAI | 8.3 | 0.9 | 9.2 |
| overall_withAI | 2.8 | 0.3 | 3.2 |
| Pathologist | No-AI (%) | With-AI (%) | Delta (pp) | Rel. red. (%) | Resolved | New | McNemar P |
|---|---|---|---|---|---|---|---|
| P1 | 14.3 | 4.2 | 10.0 | 70.4 | 94 | 13 | 0.00000 |
| P2 | 4.5 | 2.2 | 2.2 | 50.0 | 28 | 10 | 0.00582 |
| P3 | 4.5 | 2.5 | 2.0 | 44.4 | 32 | 16 | 0.03040 |
| P4 | 9.9 | 2.4 | 7.6 | 76.2 | 73 | 12 | 0.00000 |
| overall | 8.3 | 2.8 | 5.5 | 65.9 | 227 | 51 | 0.00000 |
Four pathologists read the same 806 cores, so comparisons across pathologists are paired within core.
| Test | Q | df | P |
|---|---|---|---|
| IHC, no-AI | 85.47 | 3 | 0.00e+00 |
| IHC, with-AI | 11.45 | 3 | 9.54e-03 |
| Ancillary, no-AI | 118.29 | 3 | 0.00e+00 |
| Ancillary, with-AI | 29.94 | 3 | 1.40e-06 |
| Pair | Rate A (%) | Rate B (%) | Delta (pp) | P (raw) | P (Holm) |
|---|---|---|---|---|---|
| P1 vs P2 | 14.3 | 4.5 | 9.8 | 0.0000000 | 0.0000000 |
| P1 vs P3 | 14.3 | 4.5 | 9.8 | 0.0000000 | 0.0000000 |
| P1 vs P4 | 14.3 | 9.9 | 4.3 | 0.0021718 | 0.0043436 |
| P2 vs P3 | 4.5 | 4.5 | 0.0 | 1.0000000 | 1.0000000 |
| P2 vs P4 | 4.5 | 9.9 | -5.5 | 0.0000035 | 0.0000142 |
| P3 vs P4 | 4.5 | 9.9 | -5.5 | 0.0000296 | 0.0000888 |
| Pair | Rate A (%) | Rate B (%) | Delta (pp) | P (raw) | P (Holm) |
|---|---|---|---|---|---|
| P1 vs P2 | 4.2 | 2.2 | 2.0 | 0.0124193 | 0.074516 |
| P1 vs P3 | 4.2 | 2.5 | 1.7 | 0.0140193 | 0.074516 |
| P1 vs P4 | 4.2 | 2.4 | 1.9 | 0.0179605 | 0.074516 |
| P2 vs P3 | 2.2 | 2.5 | -0.2 | 0.8501067 | 1.000000 |
| P2 vs P4 | 2.2 | 2.4 | -0.1 | 1.0000000 | 1.000000 |
| P3 vs P4 | 2.5 | 2.4 | 0.1 | 1.0000000 | 1.000000 |
| Term | Estimate | Std. error | z | P |
|---|---|---|---|---|
| (Intercept) | -5.1081 | 0.1960 | -26.0627 | 0e+00 |
| experienceJunior | 1.4940 | 0.1840 | 8.1213 | 0e+00 |
| aiwithAI | -0.8213 | 0.2481 | -3.3104 | 9e-04 |
| experienceJunior:aiwithAI | -1.0770 | 0.3183 | -3.3837 | 7e-04 |
| Term | Estimate | Std. error | z | P |
|---|---|---|---|---|
| (Intercept) | -5.1834 | 0.3555 | -14.5822 | 0e+00 |
| experienceJunior | 1.5940 | 0.1968 | 8.1013 | 0e+00 |
| aiwithAI | -0.9422 | 0.2260 | -4.1699 | 0e+00 |
| experienceJunior:aiwithAI | -0.9453 | 0.2851 | -3.3154 | 9e-04 |
| Experience | AI | N readings | IHC (%) | Ancillary (%) |
|---|---|---|---|---|
| Senior | noAI | 1612 | 4.47 | 4.84 |
| Senior | withAI | 1612 | 2.36 | 2.36 |
| Junior | noAI | 1612 | 12.10 | 13.52 |
| Junior | withAI | 1612 | 3.29 | 3.97 |
Every numeric value in the paragraphs below is generated from live R objects computed above — nothing is hard-coded. Editing the raw data and re-rendering automatically updates every figure in this section and the downstream .docx files produced by create_revised_manuscript.py.
Per-pathologist subgroup analysis. The reduction in IHC requests was consistent across all four pathologists, although its magnitude tracked baseline utilization. Pathologist 1 decreased from 14.3% to 4.2% (10.0 percentage points; 70.4% relative reduction; McNemar P < .001), and Pathologist 4 decreased from 9.9% to 2.4% (7.6 pp; 76.2% relative reduction; P < .001). The two pathologists with already lower baseline utilization also showed statistically significant reductions: Pathologist 2 from 4.5% to 2.2% (P = .006) and Pathologist 3 from 4.5% to 2.5% (P = .030). The direction of discordance was overwhelmingly toward resolution rather than new requests: across pathologists, 227 cores for which IHC had been requested without AI were resolved on review with AI, whereas AI triggered new IHC requests on only 51 cores (ratio 4.5:1). The combined ancillary-testing endpoint (IHC or consultation) decreased significantly for every pathologist (all P = .006, Holm-consistent threshold).
Differences between pathologists and effect of experience. Baseline IHC utilization varied substantially across the four pathologists (Cochran Q = 85.5, df = 3, P < .001), ranging from 4.5% (Pathologists 2 and 3) to 14.3% (Pathologist 1). Pairwise McNemar comparisons (Holm-adjusted) showed that Pathologists 1 and 4 each requested IHC significantly more often than Pathologists 2 and 3 at baseline, whereas Pathologists 2 and 3 did not differ from each other. Grouping pathologists by experience level, the two less experienced readers (Pathologists 1 and 4) ordered IHC on 12.10% of cores without AI versus 4.47% for the two more experienced readers (Pathologists 2 and 3). With AI assistance this gap narrowed to 3.29% versus 2.36%, and between-pathologist heterogeneity decreased more than 7-fold (Cochran Q = 11.4, P = .010). A generalized linear mixed model with random intercepts for core and pathologist confirmed a significant experience × AI interaction for IHC requests (P < .001); the odds-ratio reduction associated with AI was approximately 0.15 for less experienced pathologists versus 0.44 for more experienced pathologists. In practical terms, AI assistance did not merely reduce ancillary testing uniformly; it compressed between-pathologist variability and brought less experienced readers’ ancillary-testing behavior in line with that of their more experienced colleagues.
Beyond an average effect, our between-pathologist subgroup analysis suggests that AI assistance disproportionately benefits pathologists with higher baseline ancillary-testing use. The two less experienced pathologists in our cohort, who ordered IHC on approximately 2.7-fold as many cores as their more experienced colleagues at baseline, showed the largest absolute and relative reductions with AI, and a formal experience × AI interaction test was statistically significant (mixed-effects logistic regression, P < .001). With AI, between-pathologist variability in IHC use decreased more than 7-fold (Cochran Q), and the gap between less and more experienced readers narrowed from approximately 7.6 to 0.9 percentage points. This pattern is consistent with AI acting as a calibration aid that is most valuable where baseline uncertainty is highest, and it supports a deployment model in which AI-assisted review is used to standardize diagnostic behavior across readers of differing experience levels. Because each experience stratum contained only two pathologists, these findings should be confirmed in a larger reader panel; nonetheless, the direction and magnitude of the effect are consistent with prior observations that decision-support tools yield the greatest benefit for less experienced readers.
Grade Group performance with and without AI. Across the 138 Phase II cores with complete grading from every interpreter, exact agreement with the reference Grade Group rose from 49.5% to 52.7% when pooled across the four pathologists, and within-one-Grade-Group agreement rose from 85.7% to 90.8%. The largest individual gain was seen for Pathologist 1 (exact match 47.8% to 58.0%, McNemar P = .011), followed by Pathologist 3 (46.4% to 52.2%, P = .291); Pathologists 2 and 4 already had the highest baseline accuracy and showed essentially no change (P2: 50.7% to 48.6%; P4: 52.9% to 52.2%). Multi-rater agreement (Fleiss’ kappa over the four pathologists plus the reference) increased from 0.322 to 0.477 on the same 138-core subset.
To directly address whether AI influenced or suppressed IHC use, we performed a paired per-pathologist analysis using McNemar’s test on the 806 cores that each pathologist read in both conditions. Decomposing the discordant pairs showed that resolution of previously ordered IHC dominated: across all four pathologists, 227 cores had IHC ordered without AI but not with AI, whereas AI prompted new IHC on only 51 cores (ratio ≈ 4.5:1). The reduction was statistically significant for each pathologist individually (all P = .030 or smaller).
We also examined between-pathologist heterogeneity. Cochran’s Q test showed significant variation across the four pathologists at baseline (Q = 85.5, P < .001), which was markedly attenuated with AI (Q = 11.4, P = .010). Pairwise McNemar comparisons (Holm-adjusted) showed that the two less experienced pathologists (Pathologists 1 and 4) each ordered IHC significantly more often than the two more experienced readers (Pathologists 2 and 3) at baseline, whereas Pathologists 2 and 3 did not differ from each other. A generalized linear mixed model (logit link; random intercepts for core and pathologist) with experience × AI interaction indicated that the less experienced pathologists derived a greater relative benefit from AI (interaction P < .001). These results have been added to both the Results and Discussion sections of the revised manuscript.
| Tumor size | N cores | Agree no-AI (n) | Agree no-AI (%) | Agree with-AI (n) | Agree with-AI (%) |
|---|---|---|---|---|---|
| Large (>=20%) | 176 | 160 | 90.9 | 171 | 97.2 |
| Moderate (5-20%) | 14 | 3 | 21.4 | 12 | 85.7 |
| No Tumor | 573 | 428 | 75.1 | 535 | 93.5 |
| Small (<5%) | 47 | 6 | 12.8 | 24 | 51.1 |
| Pathologist | Metric | No AI | With AI |
|---|---|---|---|
| P1 | Exact match (%) | 65.00 | 85.00 |
| P1 | Mean absolute error | 0.48 | 0.20 |
| P1 | Category match (%) | 86.70 | 98.30 |
| P2 | Exact match (%) | 80.00 | 83.30 |
| P2 | Mean absolute error | 0.28 | 0.18 |
| P2 | Category match (%) | 90.00 | 95.00 |
| P3 | Exact match (%) | 65.00 | 81.70 |
| P3 | Mean absolute error | 0.62 | 0.22 |
| P3 | Category match (%) | 81.70 | 93.30 |
| P4 | Exact match (%) | 71.70 | 81.70 |
| P4 | Mean absolute error | 0.35 | 0.22 |
| P4 | Category match (%) | 88.30 | 93.30 |
| Pathologist | Mean no-AI | Mean with-AI | Wilcoxon P | N changed | Closer to ref. | Further from ref. |
|---|---|---|---|---|---|---|
| P1 | 3.07 | 3.28 | 0.00788 | 17 | 16 | 1 |
| P2 | 3.23 | 3.37 | 0.04180 | 8 | 6 | 2 |
| P3 | 2.93 | 3.23 | 0.02400 | 16 | 15 | 1 |
| P4 | 3.33 | 3.33 | 0.74500 | 11 | 7 | 3 |
After a successful render, the following JSON files should be up to date in revision1/extracted_data/:
| File | Size (B) | Modified |
|---|---|---|
| pathological_features.json | 1553 | 2026-04-21 10:50:32 |
| pni_agreement.json | 1402 | 2026-04-21 09:35:05 |
| grade_group_stats.json | 5741 | 2026-04-21 09:35:05 |
| grade_group_reconciliation.json | 4456 | 2026-04-27 22:25:27 |
| grade_group_combined.csv | 93768 | 2026-04-27 22:25:27 |
| grade_group_combined.RDS | 11638 | 2026-04-27 22:25:27 |
| ihc_rates.json | 1551 | 2026-04-21 09:35:05 |
| ihc_rates_paired_subgroup.json | 4966 | 2026-04-21 09:35:05 |
| between_pathologist_ihc.json | 6416 | 2026-04-21 09:35:08 |
| tumor_percent_agreement.json | 750 | 2026-04-21 09:35:08 |
| positive_core_counts.json | 2154 | 2026-04-21 09:35:08 |
R version 4.5.1 (2025-06-13)
Platform: aarch64-apple-darwin20
Running under: macOS Tahoe 26.4.1

Matrix products: default
BLAS:   /Library/Frameworks/R.framework/Versions/4.5-arm64/Resources/lib/libRblas.0.dylib
LAPACK: /Library/Frameworks/R.framework/Versions/4.5-arm64/Resources/lib/libRlapack.dylib;  LAPACK version 3.12.1

locale:
[1] C.UTF-8/C.UTF-8/C.UTF-8/C/C.UTF-8/C.UTF-8

time zone: Europe/Istanbul
tzcode source: internal

attached base packages:
[1] stats     graphics  grDevices utils     datasets  methods   base

other attached packages:
 [1] here_1.0.2     knitr_1.51     lme4_1.1-38    Matrix_1.7-4   irr_0.84.1
 [6] lpSolve_5.6.23 jsonlite_2.0.0 readxl_1.4.5   tidyr_1.3.2    dplyr_1.1.4
[11] magrittr_2.0.4

loaded via a namespace (and not attached):
 [1] compiler_4.5.1    Rcpp_1.1.0        tidyselect_1.2.1  splines_4.5.1
 [5] boot_1.3-32       yaml_2.3.12       fastmap_1.2.0     lattice_0.22-7
 [9] R6_2.6.1          generics_0.1.4    forcats_1.0.1     rbibutils_2.4
[13] htmlwidgets_1.6.4 MASS_7.3-65       tibble_3.3.0      nloptr_2.2.1
[17] rprojroot_2.1.1   minqa_1.2.8       pillar_1.11.1     rlang_1.1.6
[21] xfun_0.55         otel_0.2.0        cli_3.6.5         withr_3.0.2
[25] Rdpack_2.6.4      digest_0.6.39     grid_4.5.1        nlme_3.1-168
[29] lifecycle_1.0.4   reformulas_0.4.3  vctrs_0.6.5       evaluate_1.0.5
[33] glue_1.8.0        cellranger_1.1.0  codetools_0.2-20  rmarkdown_2.30
[37] purrr_1.2.0       tools_4.5.1       pkgconfig_2.0.3   htmltools_0.5.9