11 Learning Curve and Fatigue Analysis
12 Learning Curve and Fatigue Analysis
This section investigates whether there is a “Learning Curve” (diagnosis becoming faster over time) or “Fatigue Effect” (diagnosis becoming slower or less accurate later in the day).
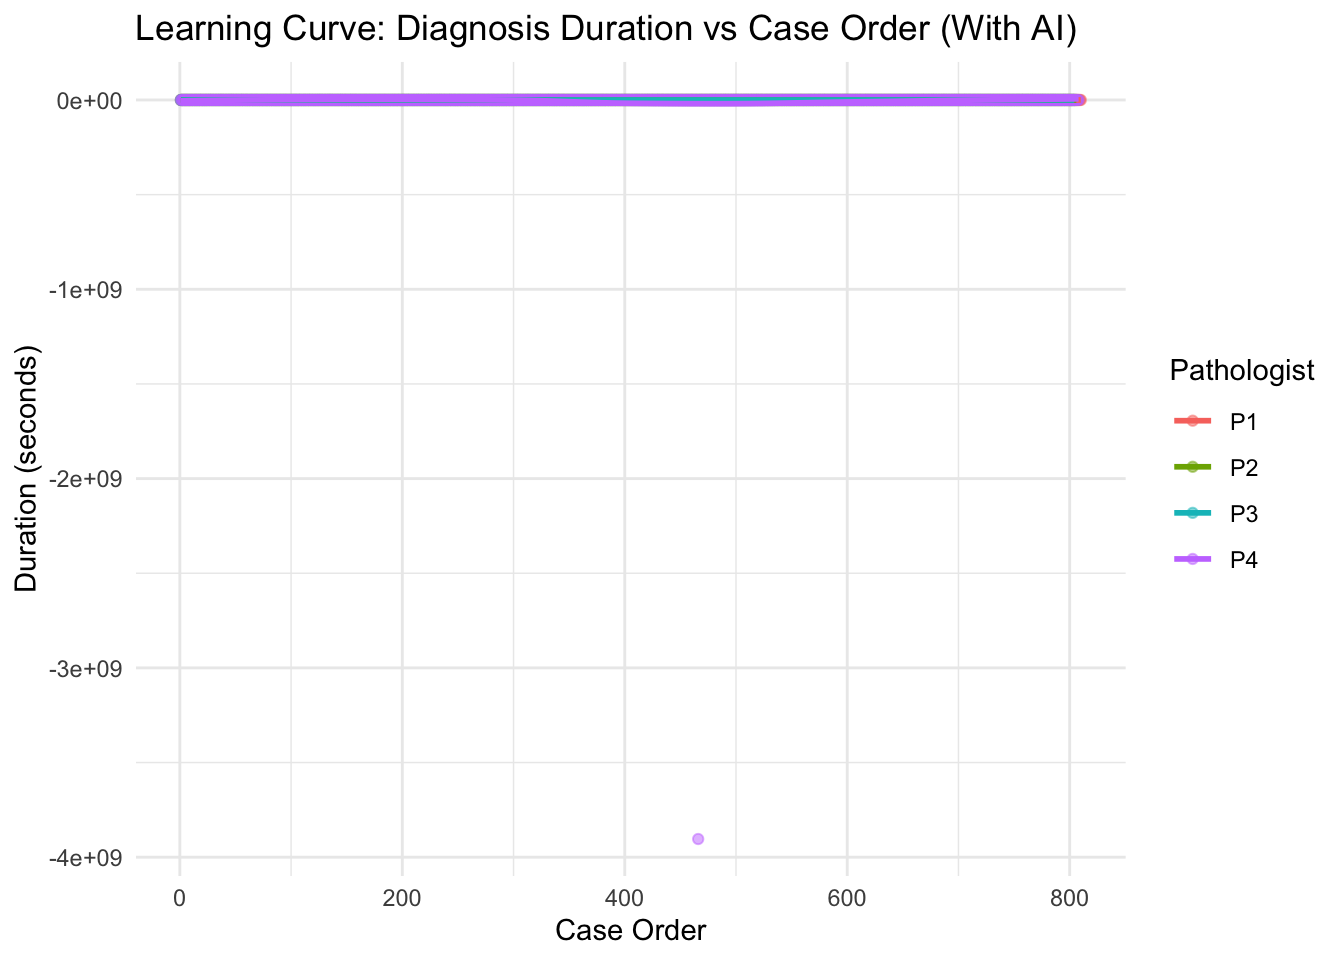
12.1 Diagnosis Duration vs Case Order
We assume the order of cases corresponds to the Start_Time.
Note for Pathologists: This plot visualizes how the time taken to diagnose cases changes as pathologists progress through the case list (Learning Curve). A downward trend suggests getting faster/more comfortable with the AI tool.
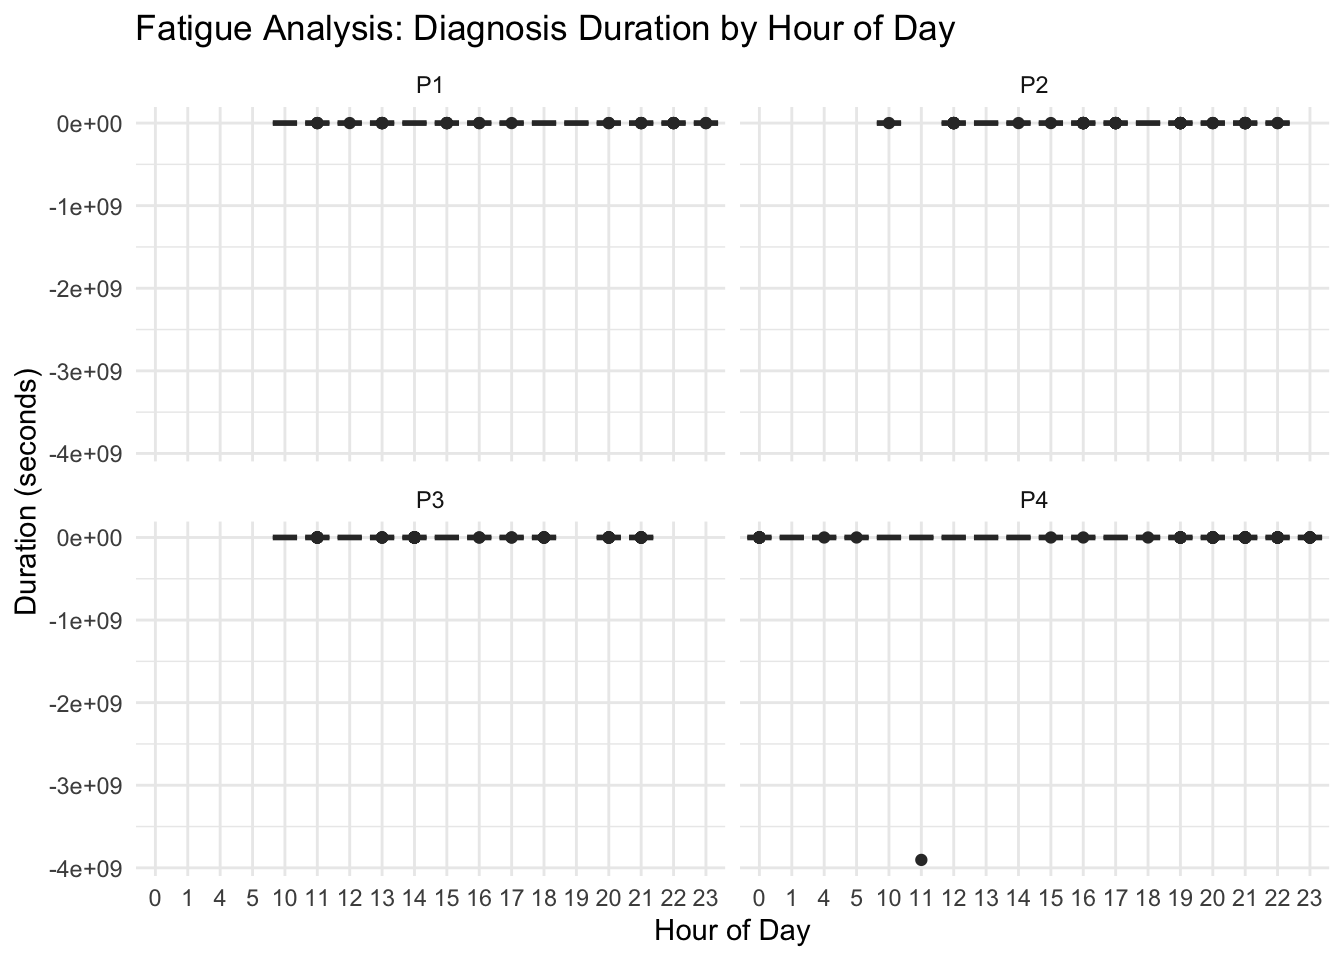
12.2 Fatigue Analysis: Duration vs Time of Day
Does diagnosis take longer later in the day?
Note for Pathologists: This analysis checks for ‘Fatigue’ by grouping diagnosis times by the hour of the day. Consistently higher times in later hours could indicate fatigue.
12.3 Statistical Test for Trend
We use a linear model to test if Case_Order significantly predicts Duration.
Note for Pathologists: A statistical test (Linear Regression) to determine if the trend seen in the Learning Curve is significant. A negative slope means faster diagnosis over time.
| Pathologist | Slope | P_Value |
|---|---|---|
| P1 | -0.0021 | 0.6444 |
| P2 | -0.0003 | 0.9741 |
| P3 | 0.0040 | 0.3843 |
| P4 | -5461.7654 | 0.7922 |
A negative slope indicates a learning effect (getting faster). A positive slope might indicate fatigue or increasing complexity of later cases.