 INTERRATER RELIABILITY

 Interrater Reliability
 ───────────────────────────────────────────────────────────────────
                  Cohen's Kappa for 2 Raters (Weights: unweighted)
 ───────────────────────────────────────────────────────────────────
   Subjects                                                    851
   Raters                                                        2
   Agreement %                                            96.59224
   Kappa                                                 0.9135989
   z                                                      26.73807
   p-value        < .0000001
─────────────────────────────────────────────────────────────────── 4 Report vs AI (First Phase)
4.1 Core Level
Number of Cases: 60
Number of Slides: 851
Minimum number of blocks: 6
Maximum number of blocks: 24
Median number of blocks: 14
4.1.1 Paige Diagnosis vs Report Diagnosis
Note for Pathologists: This table shows the agreement between the AI’s diagnosis and the original pathology report. High agreement (Kappa near 1) indicates consistency.
Note for Pathologists: The following table details the distribution of diagnoses, comparing the AI result (rows) against the Report result (columns).
Dx_Report
|
Total | ||
|---|---|---|---|
| Benign | Suspicious | ||
| Dx_Paige | |||
| Benign | 607 (96%) | 1 (0.5%) | 608 (71%) |
| Suspicious | 28 (4.4%) | 215 (100%) | 243 (29%) |
| Total | 635 (100%) | 216 (100%) | 851 (100%) |
4.1.2 Paige Diagnosis vs Research Diagnosis (with IHC Reference Diagnosis)
AI diagnosis agree with Final Diagnosis in 97.6% of cores (kappa=0.94, p<0.0001).
Note for Pathologists: Here we compare the AI diagnosis against the final Research diagnosis (which includes IHC verification). This serves as the ‘Reference Diagnosis’ comparison.
 INTERRATER RELIABILITY

 Interrater Reliability
 ───────────────────────────────────────────────────────────────────
                  Cohen's Kappa for 2 Raters (Weights: unweighted)
 ───────────────────────────────────────────────────────────────────
   Subjects                                                    851
   Raters                                                        2
   Agreement %                                            97.64982
   Kappa                                                 0.9410906
   z                                                      27.49207
   p-value        < .0000001
 ───────────────────────────────────────────────────────────────────
Dx_Research
|
Total | ||
|---|---|---|---|
| Benign | Suspicious | ||
| Dx_Paige | |||
| Benign | 607 (97%) | 1 (0.4%) | 608 (71%) |
| Suspicious | 19 (3.0%) | 224 (100%) | 243 (29%) |
| Total | 626 (100%) | 225 (100%) | 851 (100%) |
Note for Pathologists: This analysis evaluates the diagnostic performance (Sensitivity, Specificity, etc.) of the AI model against the Research Diagnosis (Reference Diagnosis).
1/1
1/1

 MEDICAL DECISION

 Recoded Data for Decision Test Statistics
 ────────────────────────────────────────────────────────────
                    Gold Positive    Gold Negative    Total
 ────────────────────────────────────────────────────────────
   Test Positive              224               19      243
   Test Negative                1              607      608
   Total                      225              626      851
 ────────────────────────────────────────────────────────────


 n
 ─────────────────────────

 ─────────────────────────
   Total             851
   Diseased          225
   Healthy           626
   Positive Tests    243
   Negative Tests    608
   True Test         831
   Wrong Test         20
 ─────────────────────────


 ────────────────────────────────────────────────

 ────────────────────────────────────────────────
   Sensitivity                       99.5555556
   Specificity                       96.9648562
   Accuracy                          97.6498237
   Prevalence                        26.4394830
   Positive Predictive Value         92.1810700
   Negative Predictive Value         99.8355263
   Post-test Disease Probability     92.1810700
   Post-test Health Probability      99.8355263
   Positive Likelihood Ratio           32.80094
   Negative Likelihood Ratio        0.004583562
 ────────────────────────────────────────────────


 EpiR Table Ratios
 ────────────────────────────────────────────────────────────────────
   Decision Statistics          Estimate     Lower        Upper
 ────────────────────────────────────────────────────────────────────
   Sensitivity                   99.55556     97.54873     99.98875
   Specificity                   96.96486     95.30070     98.16296
   Positive predictive value     92.18107     88.05896     95.22700
   Negative predictive value     99.83553     99.08705     99.99584
 ────────────────────────────────────────────────────────────────────


 ────────────────────────────────────────────────────────────────────────────────
   Decision Statistics          Estimate          Lower          Upper
 ────────────────────────────────────────────────────────────────────────────────
   Positive likelihood ratio      32.800935673     21.0647429       51.07593218
   Negative likelihood ratio       0.004583562    6.484462e-4        0.03239905
   Diagnostic odds ratio        7156.210526316    952.4389030    53768.64482869
   Youden's index                  0.965204118      0.9284943        0.98151707
   Number needed to diagnose       1.036050284      1.0188310        1.07701254
 ────────────────────────────────────────────────────────────────────────────────


 <div style='margin: 15px; padding: 15px; border-left: 5px solid
 #4CAF50; background: #f1f8e9;'><h3 style='color: #2E7D32; margin-top:
 0;'>Clinical Summary

 <p style='font-size: 16px;'>Analysis: Diagnostic test performance
 evaluation comparing Dx_Paige against gold standard Dx_Research.

 Sample: 851 cases analyzed with 26.4% disease prevalence.

 Test Performance: The test shows excellent discriminatory ability with
 sensitivity of 99.6% (*Excellent for ruling OUT disease*) and
 specificity of 97.0% (*Excellent for ruling IN disease*).

 Clinical Utility: This test is most useful for both ruling out and
 confirming disease in the clinical setting.

 Likelihood Ratios: Positive LR: 32.80 (*Strong evidence for disease*),
 Negative LR: 0.00 (*Strong evidence against disease*)

 Key Findings: When positive, the post-test disease probability is
 92.2% (PPV 92.2%). When negative, the disease probability falls to
 0.2% and the probability of being disease-free is 99.8% (NPV 99.8%).

 <div style='margin: 15px; padding: 10px; border-left: 4px solid
 #2196F3; background: #f8f9fa;'><h4 style='color: #1976D2; margin-top:
 0;'>Clinical Interpretation

 Test Performance Summary:

 Sensitivity: 99.6% - Excellent for ruling out diseaseSpecificity:
 97.0% - Excellent for ruling in diseaseYouden's Index: 0.965 -
 Excellent discriminatory power

 Likelihood Ratio Interpretation:

 Positive LR (32.80): Large and often conclusive increase in
 probability of diseaseNegative LR (0.00): Large and often conclusive
 decrease in probability of disease

 Clinical Decision Making:

 Pre-test probability: 26.4%Post-test probability (if positive):
 92.2%Post-test probability (if negative): 99.8%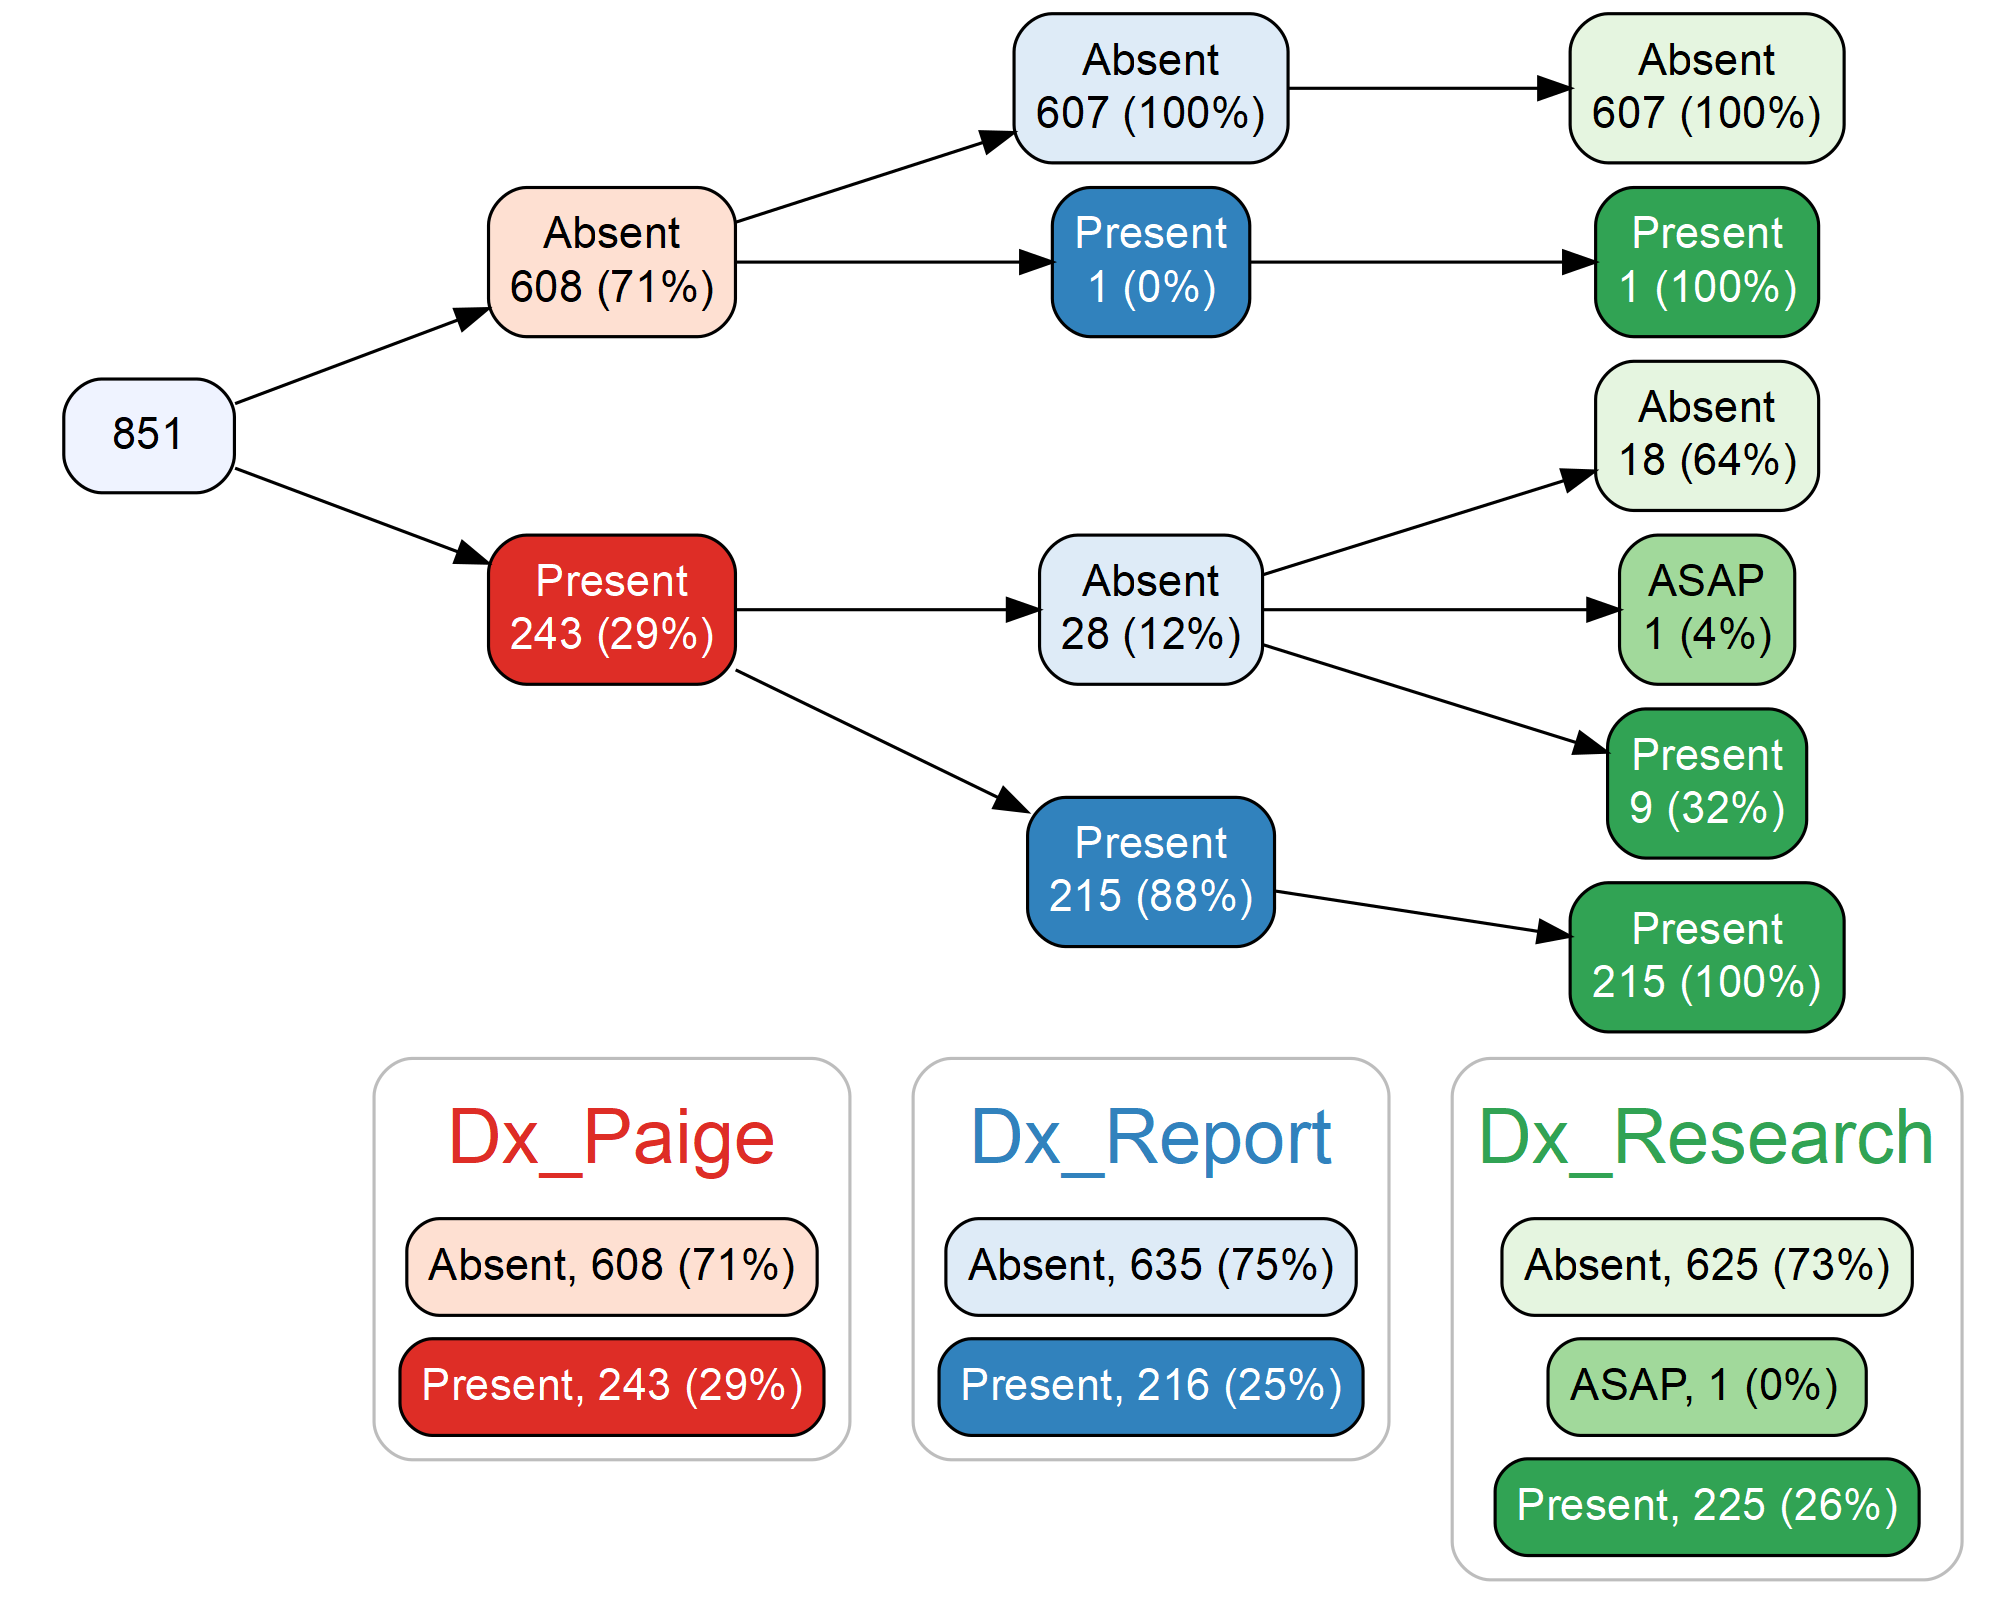
4.2 Patient Level
Agreement Paige Diagnosis vs Report Diagnosis, Patient Level
Note for Pathologists: Agreement analysis at the patient level (aggregated per case) between AI and the original Report.
 INTERRATER RELIABILITY

 Interrater Reliability
 ───────────────────────────────────────────────────────────────────
                  Cohen's Kappa for 2 Raters (Weights: unweighted)
 ───────────────────────────────────────────────────────────────────
   Subjects                                                     60
   Raters                                                        2
   Agreement %                                            90.00000
   Kappa                                                 0.7906977
   z                                                      6.263447
   p-value        < .0000001
 ───────────────────────────────────────────────────────────────────
Agreement Paige Diagnosis vs Research Diagnosis, Patient Level
Note for Pathologists: Agreement analysis at the patient level between AI and the final Research Diagnosis.
 INTERRATER RELIABILITY

 Interrater Reliability
 ───────────────────────────────────────────────────────────────────
                  Cohen's Kappa for 2 Raters (Weights: unweighted)
 ───────────────────────────────────────────────────────────────────
   Subjects                                                     60
   Raters                                                        2
   Agreement %                                            93.33333
   Kappa                                                 0.8571429
   z                                                      6.708204
   p-value        < .0000001
 ───────────────────────────────────────────────────────────────────
Cases where Paige is positive and Report is Negative, Patient Level
# A tibble: 6 × 4
  caseNo Dx_Paige_by_Case Dx_Report_by_Case Dx_Research_by_Case
  <chr>             <dbl>             <dbl>               <dbl>
1 c19                   1                 0                   0
2 c20                   1                 0                   0
3 c26                   1                 0                   0
4 c29                   1                 0                   0
5 c30                   1                 0                   1
6 c54                   1                 0                   1
Cases where Paige is positive and Research (Reference Diagnosis) is Negative, Patient Level
# A tibble: 4 × 4
  caseNo Dx_Paige_by_Case Dx_Report_by_Case Dx_Research_by_Case
  <chr>             <dbl>             <dbl>               <dbl>
1 c19                   1                 0                   0
2 c20                   1                 0                   0
3 c26                   1                 0                   0
4 c29                   1                 0                   0
Decision Tests of Paige vs Research Diagnosis (as Reference Diagnosis), Patient Level
Note for Pathologists: Diagnostic performance metrics at the patient level, treating the Research Diagnosis as the Reference Diagnosis.
1/1
1/1

 MEDICAL DECISION

 Recoded Data for Decision Test Statistics
 ────────────────────────────────────────────────────────────
                    Gold Positive    Gold Negative    Total
 ────────────────────────────────────────────────────────────
   Test Positive               36                4       40
   Test Negative                0               20       20
   Total                       36               24       60
 ────────────────────────────────────────────────────────────


 n
 ────────────────────────

 ────────────────────────
   Total             60
   Diseased          36
   Healthy           24
   Positive Tests    40
   Negative Tests    20
   True Test         56
   Wrong Test         4
 ────────────────────────


 ──────────────────────────────────────────────

 ──────────────────────────────────────────────
   Sensitivity                      100.000000
   Specificity                      83.3333333
   Accuracy                         93.3333333
   Prevalence                       60.0000000
   Positive Predictive Value        90.0000000
   Negative Predictive Value        100.000000
   Post-test Disease Probability    90.0000000
   Post-test Health Probability     100.000000
   Positive Likelihood Ratio         6.000000
   Negative Likelihood Ratio         0.000000
 ──────────────────────────────────────────────


 EpiR Table Ratios
 ────────────────────────────────────────────────────────────────────
   Decision Statistics          Estimate     Lower        Upper
 ────────────────────────────────────────────────────────────────────
   Sensitivity                  100.00000     90.26062    100.00000
   Specificity                   83.33333     62.61583     95.26464
   Positive predictive value     90.00000     76.33626     97.20746
   Negative predictive value    100.00000     83.15665    100.00000
 ────────────────────────────────────────────────────────────────────


 ─────────────────────────────────────────────────────────────────────
   Decision Statistics          Estimate     Lower        Upper
 ─────────────────────────────────────────────────────────────────────
   Positive likelihood ratio    6.0000000    2.4526336    14.6780993
   Negative likelihood ratio    0.0000000    0.0000000           NaN
   Diagnostic odds ratio              Inf          NaN           Inf
   Youden's index               0.8333333    0.5287645     0.9526464
   Number needed to diagnose    1.2000000    1.0497075     1.8912010
 ─────────────────────────────────────────────────────────────────────


 <div style='margin: 15px; padding: 15px; border-left: 5px solid
 #4CAF50; background: #f1f8e9;'><h3 style='color: #2E7D32; margin-top:
 0;'>Clinical Summary

 <p style='font-size: 16px;'>Analysis: Diagnostic test performance
 evaluation comparing Dx_Paige_by_Case against gold standard
 Dx_Research_by_Case.

 Sample: 60 cases analyzed with 60.0% disease prevalence.

 Test Performance: The test shows good discriminatory ability with
 sensitivity of 100.0% (*Excellent for ruling OUT disease*) and
 specificity of 83.3% (*Good for ruling IN disease*).

 Clinical Utility: This test is most useful for both ruling out and
 confirming disease in the clinical setting.

 Likelihood Ratios: Positive LR: 6.00 (*Moderate evidence for
 disease*), Negative LR: 0.00 (*Strong evidence against disease*)

 Key Findings: When positive, the post-test disease probability is
 90.0% (PPV 90.0%). When negative, the disease probability falls to
 0.0% and the probability of being disease-free is 100.0% (NPV 100.0%).

 <div style='margin: 15px; padding: 10px; border-left: 4px solid
 #2196F3; background: #f8f9fa;'><h4 style='color: #1976D2; margin-top:
 0;'>Clinical Interpretation

 Test Performance Summary:

 Sensitivity: 100.0% - Excellent for ruling out diseaseSpecificity:
 83.3% - Good for ruling in diseaseYouden's Index: 0.833 - Excellent
 discriminatory power

 Likelihood Ratio Interpretation:

 Positive LR (6.00): Moderate increase in probability of
 diseaseNegative LR (0.00): Large and often conclusive decrease in
 probability of disease

 Clinical Decision Making:

 Pre-test probability: 60.0%Post-test probability (if positive):
 90.0%Post-test probability (if negative): 100.0%
AI diagnosis agree with Report Diagnosis in 96.6% of cores (kappa=0.91, p<0.0001).