| Interpreter | Mean | Median | Min | Max |
|---|---|---|---|---|
| Reference | 3.42 | 1 | 0 | 16 |
| P1 Without AI | 3.07 | 1 | 0 | 16 |
| P1 With AI | 3.28 | 1 | 0 | 16 |
| P2 Without AI | 3.23 | 1 | 0 | 16 |
| P2 With AI | 3.37 | 1 | 0 | 16 |
| P3 Without AI | 2.93 | 1 | 0 | 16 |
| P3 With AI | 3.23 | 1 | 0 | 16 |
| P4 Without AI | 3.33 | 1 | 0 | 15 |
| P4 With AI | 3.33 | 1 | 0 | 16 |
24 Risk Stratification: Positive Core Count Analysis
25 Risk Stratification: AI Impact on Positive Core Counts
25.1 Positive Core Counts Per Case
25.1.1 Summary Statistics
Note for Pathologists: Mean and median number of malignant cores per case, comparing pathologist assessment without and with AI, against the reference diagnosis.
25.1.2 Paired Comparison: Without AI vs With AI
Note for Pathologists: Wilcoxon signed-rank test comparing the number of malignant cores per case between assessments without and with AI for each pathologist.
| Pathologist | Mean noAI | Mean withAI | Mean Diff | Cases Changed | Increased | Decreased | Wilcoxon V | P value |
|---|---|---|---|---|---|---|---|---|
| P1 | 3.07 | 3.28 | 0.22 | 17/60 (28.3%) | 14 | 3 | 127.5 | 0.0079 |
| P2 | 3.23 | 3.37 | 0.13 | 8/60 (13.3%) | 7 | 1 | 32.0 | 0.0418 |
| P3 | 2.93 | 3.23 | 0.30 | 16/60 (26.7%) | 12 | 4 | 110.0 | 0.0240 |
| P4 | 3.33 | 3.33 | 0.00 | 11/60 (18.3%) | 7 | 4 | 37.0 | 0.7452 |
25.2 Concordance with Reference Diagnosis
This section evaluates how accurately each pathologist’s positive core count matches the reference (gold standard) diagnosis, and whether AI improves this concordance.
25.2.1 Exact Match and Mean Absolute Error
Note for Pathologists: The exact match rate shows how often the pathologist’s malignant core count per case exactly matches the reference. MAE (Mean Absolute Error) shows the average discrepancy in core count.
| Pathologist | Exact Match noAI | Exact Match withAI | MAE noAI | MAE withAI | Spearman rho noAI | Spearman rho withAI |
|---|---|---|---|---|---|---|
| P1 | 65.0% | 85.0% | 0.483 | 0.200 | 0.946 | 0.996 |
| P2 | 80.0% | 83.3% | 0.283 | 0.183 | 0.979 | 0.990 |
| P3 | 65.0% | 81.7% | 0.617 | 0.217 | 0.907 | 0.983 |
| P4 | 71.7% | 81.7% | 0.350 | 0.217 | 0.976 | 0.989 |
25.2.2 Direction of Changes Relative to Reference
Note for Pathologists: Among cases where the positive core count changed with AI, this shows whether the change moved the count closer to or further from the reference diagnosis.
| Pathologist | N Changed | Closer to Reference | Further from Reference | Same Distance |
|---|---|---|---|---|
| P1 | 17 | 16 (94%) | 1 (6%) | 0 (0%) |
| P2 | 8 | 6 (75%) | 2 (25%) | 0 (0%) |
| P3 | 16 | 15 (94%) | 1 (6%) | 0 (0%) |
| P4 | 11 | 7 (64%) | 3 (27%) | 1 (9%) |
25.3 Risk-Relevant Core Count Categories
The number of positive biopsy cores is categorized into risk-relevant thresholds based on clinical guidelines:
- No positive cores: Benign case
- <3 positive cores: Relevant for Very Low risk classification
- 3+ cores, <50% positive: Intermediate range
- ≥50% positive cores: Higher involvement, relevant for risk escalation
The percentage of positive biopsy cores (<50%) is a criterion distinguishing intermediate-favorable from intermediate-unfavorable risk.
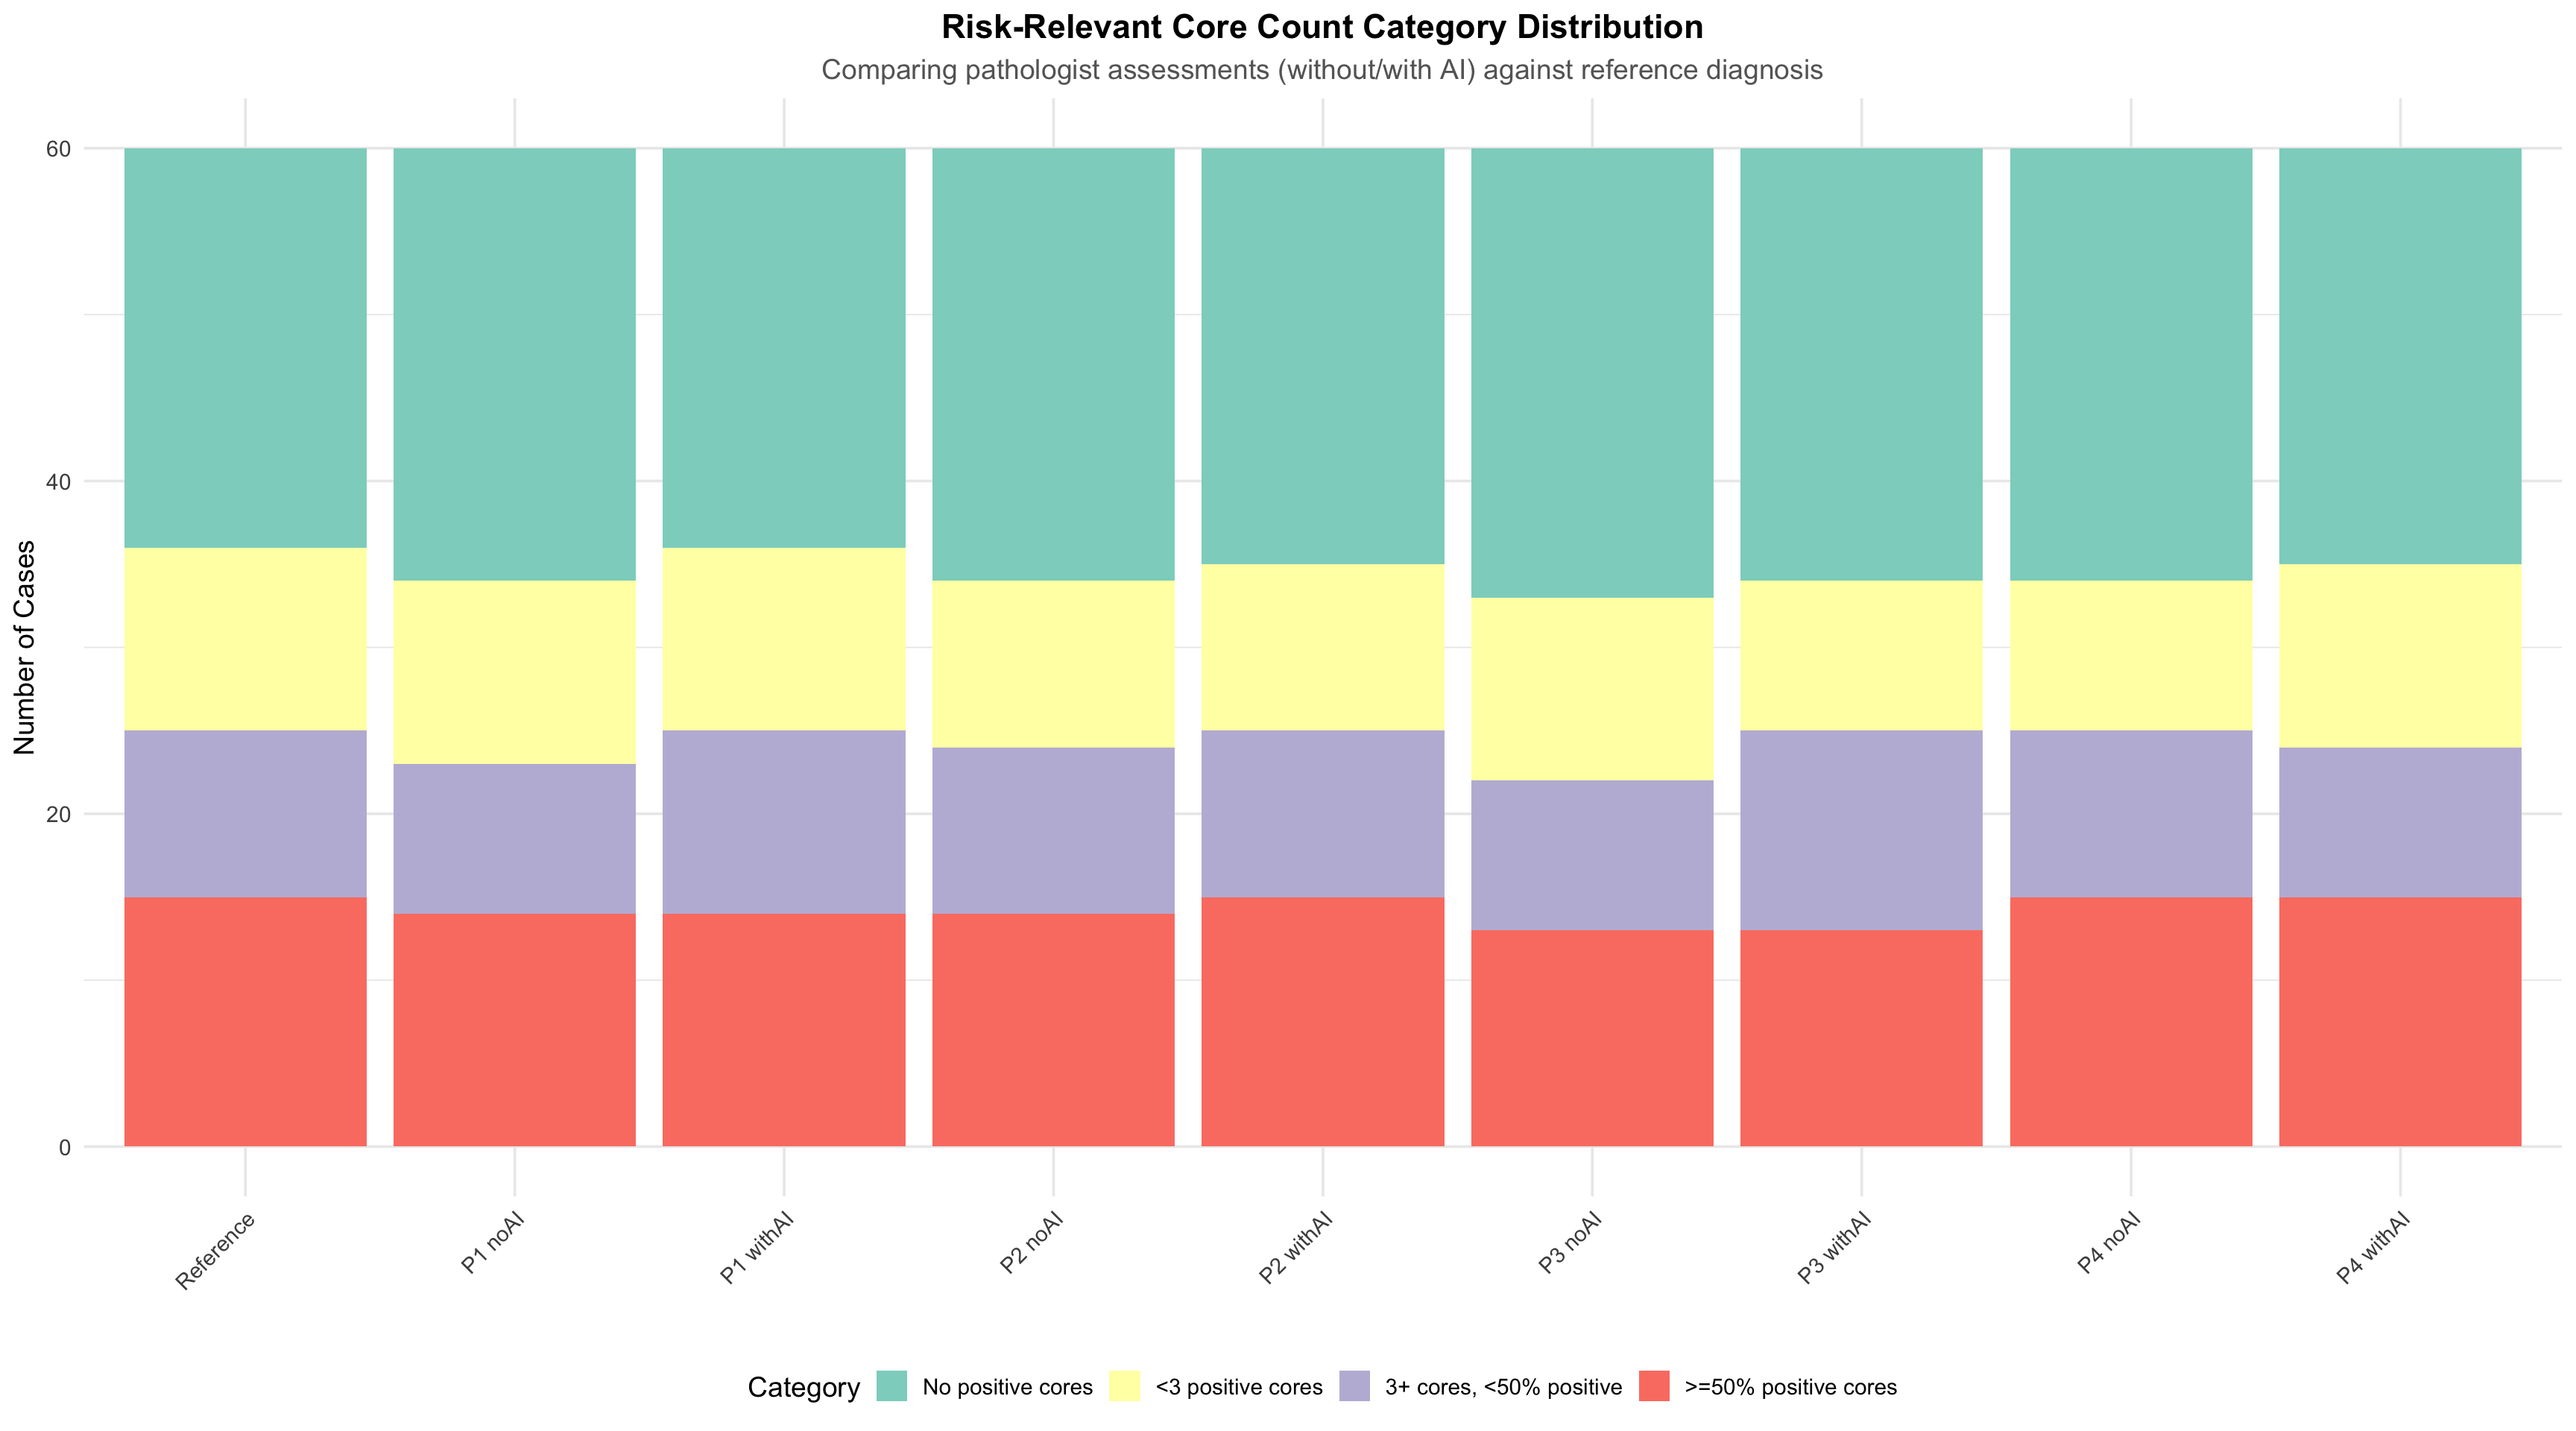
25.3.1 Category Distribution
Note for Pathologists: Distribution of cases across risk-relevant positive core count categories, comparing reference, without AI, and with AI assessments.
| Interpreter | No positive cores | <3 positive cores | 3+ cores, <50% positive | >=50% positive cores |
|---|---|---|---|---|
| Reference | 24 | 11 | 10 | 15 |
| P1 Without AI | 26 | 11 | 9 | 14 |
| P1 With AI | 24 | 11 | 11 | 14 |
| P2 Without AI | 26 | 10 | 10 | 14 |
| P2 With AI | 25 | 10 | 10 | 15 |
| P3 Without AI | 27 | 11 | 9 | 13 |
| P3 With AI | 26 | 9 | 12 | 13 |
| P4 Without AI | 26 | 9 | 10 | 15 |
| P4 With AI | 25 | 11 | 9 | 15 |
25.3.2 Category Concordance with Reference
Note for Pathologists: Percentage of cases where the pathologist’s risk-relevant core count category matches the reference diagnosis.
| Pathologist | Match noAI (%) | Match withAI (%) | Change (pp) |
|---|---|---|---|
| P1 | 86.7 | 98.3 | 11.7 |
| P2 | 90.0 | 95.0 | 5.0 |
| P3 | 81.7 | 93.3 | 11.7 |
| P4 | 88.3 | 93.3 | 5.0 |
25.3.3 Cases with Category Changes
Note for Pathologists: Detailed listing of cases where the risk-relevant core count category changed with AI assistance.
25.3.3.1 Pathologist 1: 7 cases with category change
| Case | Total Cores | Ref Positive | noAI Positive | withAI Positive | noAI Category | withAI Category |
|---|---|---|---|---|---|---|
| c1 | 13 | 6 | 7 | 6 | >=50% positive cores | 3+ cores, <50% positive |
| c2 | 8 | 0 | 1 | 0 | <3 positive cores | No positive cores |
| c30 | 14 | 1 | 0 | 1 | No positive cores | <3 positive cores |
| c32 | 13 | 3 | 2 | 3 | <3 positive cores | 3+ cores, <50% positive |
| c47 | 15 | 8 | 7 | 8 | 3+ cores, <50% positive | >=50% positive cores |
| c54 | 15 | 1 | 0 | 1 | No positive cores | <3 positive cores |
| c58 | 11 | 5 | 0 | 3 | No positive cores | 3+ cores, <50% positive |
25.3.3.2 Pathologist 2: 3 cases with category change
| Case | Total Cores | Ref Positive | noAI Positive | withAI Positive | noAI Category | withAI Category |
|---|---|---|---|---|---|---|
| c47 | 15 | 8 | 7 | 8 | 3+ cores, <50% positive | >=50% positive cores |
| c54 | 15 | 1 | 0 | 1 | No positive cores | <3 positive cores |
| c58 | 11 | 5 | 1 | 4 | <3 positive cores | 3+ cores, <50% positive |
25.3.3.3 Pathologist 3: 9 cases with category change
| Case | Total Cores | Ref Positive | noAI Positive | withAI Positive | noAI Category | withAI Category |
|---|---|---|---|---|---|---|
| c2 | 8 | 0 | 1 | 0 | <3 positive cores | No positive cores |
| c22 | 17 | 0 | 1 | 0 | <3 positive cores | No positive cores |
| c28 | 9 | 2 | 0 | 1 | No positive cores | <3 positive cores |
| c37 | 14 | 9 | 3 | 8 | 3+ cores, <50% positive | >=50% positive cores |
| c42 | 18 | 4 | 2 | 4 | <3 positive cores | 3+ cores, <50% positive |
| c47 | 15 | 8 | 8 | 7 | >=50% positive cores | 3+ cores, <50% positive |
| c54 | 15 | 1 | 0 | 1 | No positive cores | <3 positive cores |
| c58 | 11 | 5 | 0 | 3 | No positive cores | 3+ cores, <50% positive |
| c59 | 17 | 6 | 1 | 5 | <3 positive cores | 3+ cores, <50% positive |
25.3.3.4 Pathologist 4: 5 cases with category change
| Case | Total Cores | Ref Positive | noAI Positive | withAI Positive | noAI Category | withAI Category |
|---|---|---|---|---|---|---|
| c23 | 11 | 1 | 0 | 1 | No positive cores | <3 positive cores |
| c30 | 14 | 1 | 2 | 0 | <3 positive cores | No positive cores |
| c54 | 15 | 1 | 0 | 1 | No positive cores | <3 positive cores |
| c6 | 12 | 2 | 7 | 2 | >=50% positive cores | <3 positive cores |
| c7 | 12 | 6 | 5 | 6 | 3+ cores, <50% positive | >=50% positive cores |
25.4 Percentage of Positive Cores
The percentage of positive biopsy cores (<50% vs ≥50%) is a criterion for distinguishing intermediate-favorable from intermediate-unfavorable risk groups. This analysis evaluates the mean percentage of positive cores among malignant cases.
Note for Pathologists: Among cases with at least one malignant core, the mean percentage of positive cores and the number of cases below the 50% threshold.
| Pathologist | N Cases | Mean % noAI | Mean % withAI | <50% noAI (N) | <50% withAI (N) | >=50% noAI (N) | >=50% withAI (N) |
|---|---|---|---|---|---|---|---|
| P1 | 37 | 39.6 | 42.1 | 20 | 22 | 14 | 14 |
| P2 | 35 | 43.9 | 45.6 | 20 | 20 | 14 | 15 |
| P3 | 36 | 39.1 | 42.5 | 20 | 21 | 13 | 13 |
| P4 | 36 | 44.0 | 43.6 | 19 | 20 | 15 | 15 |
25.5 Visualization
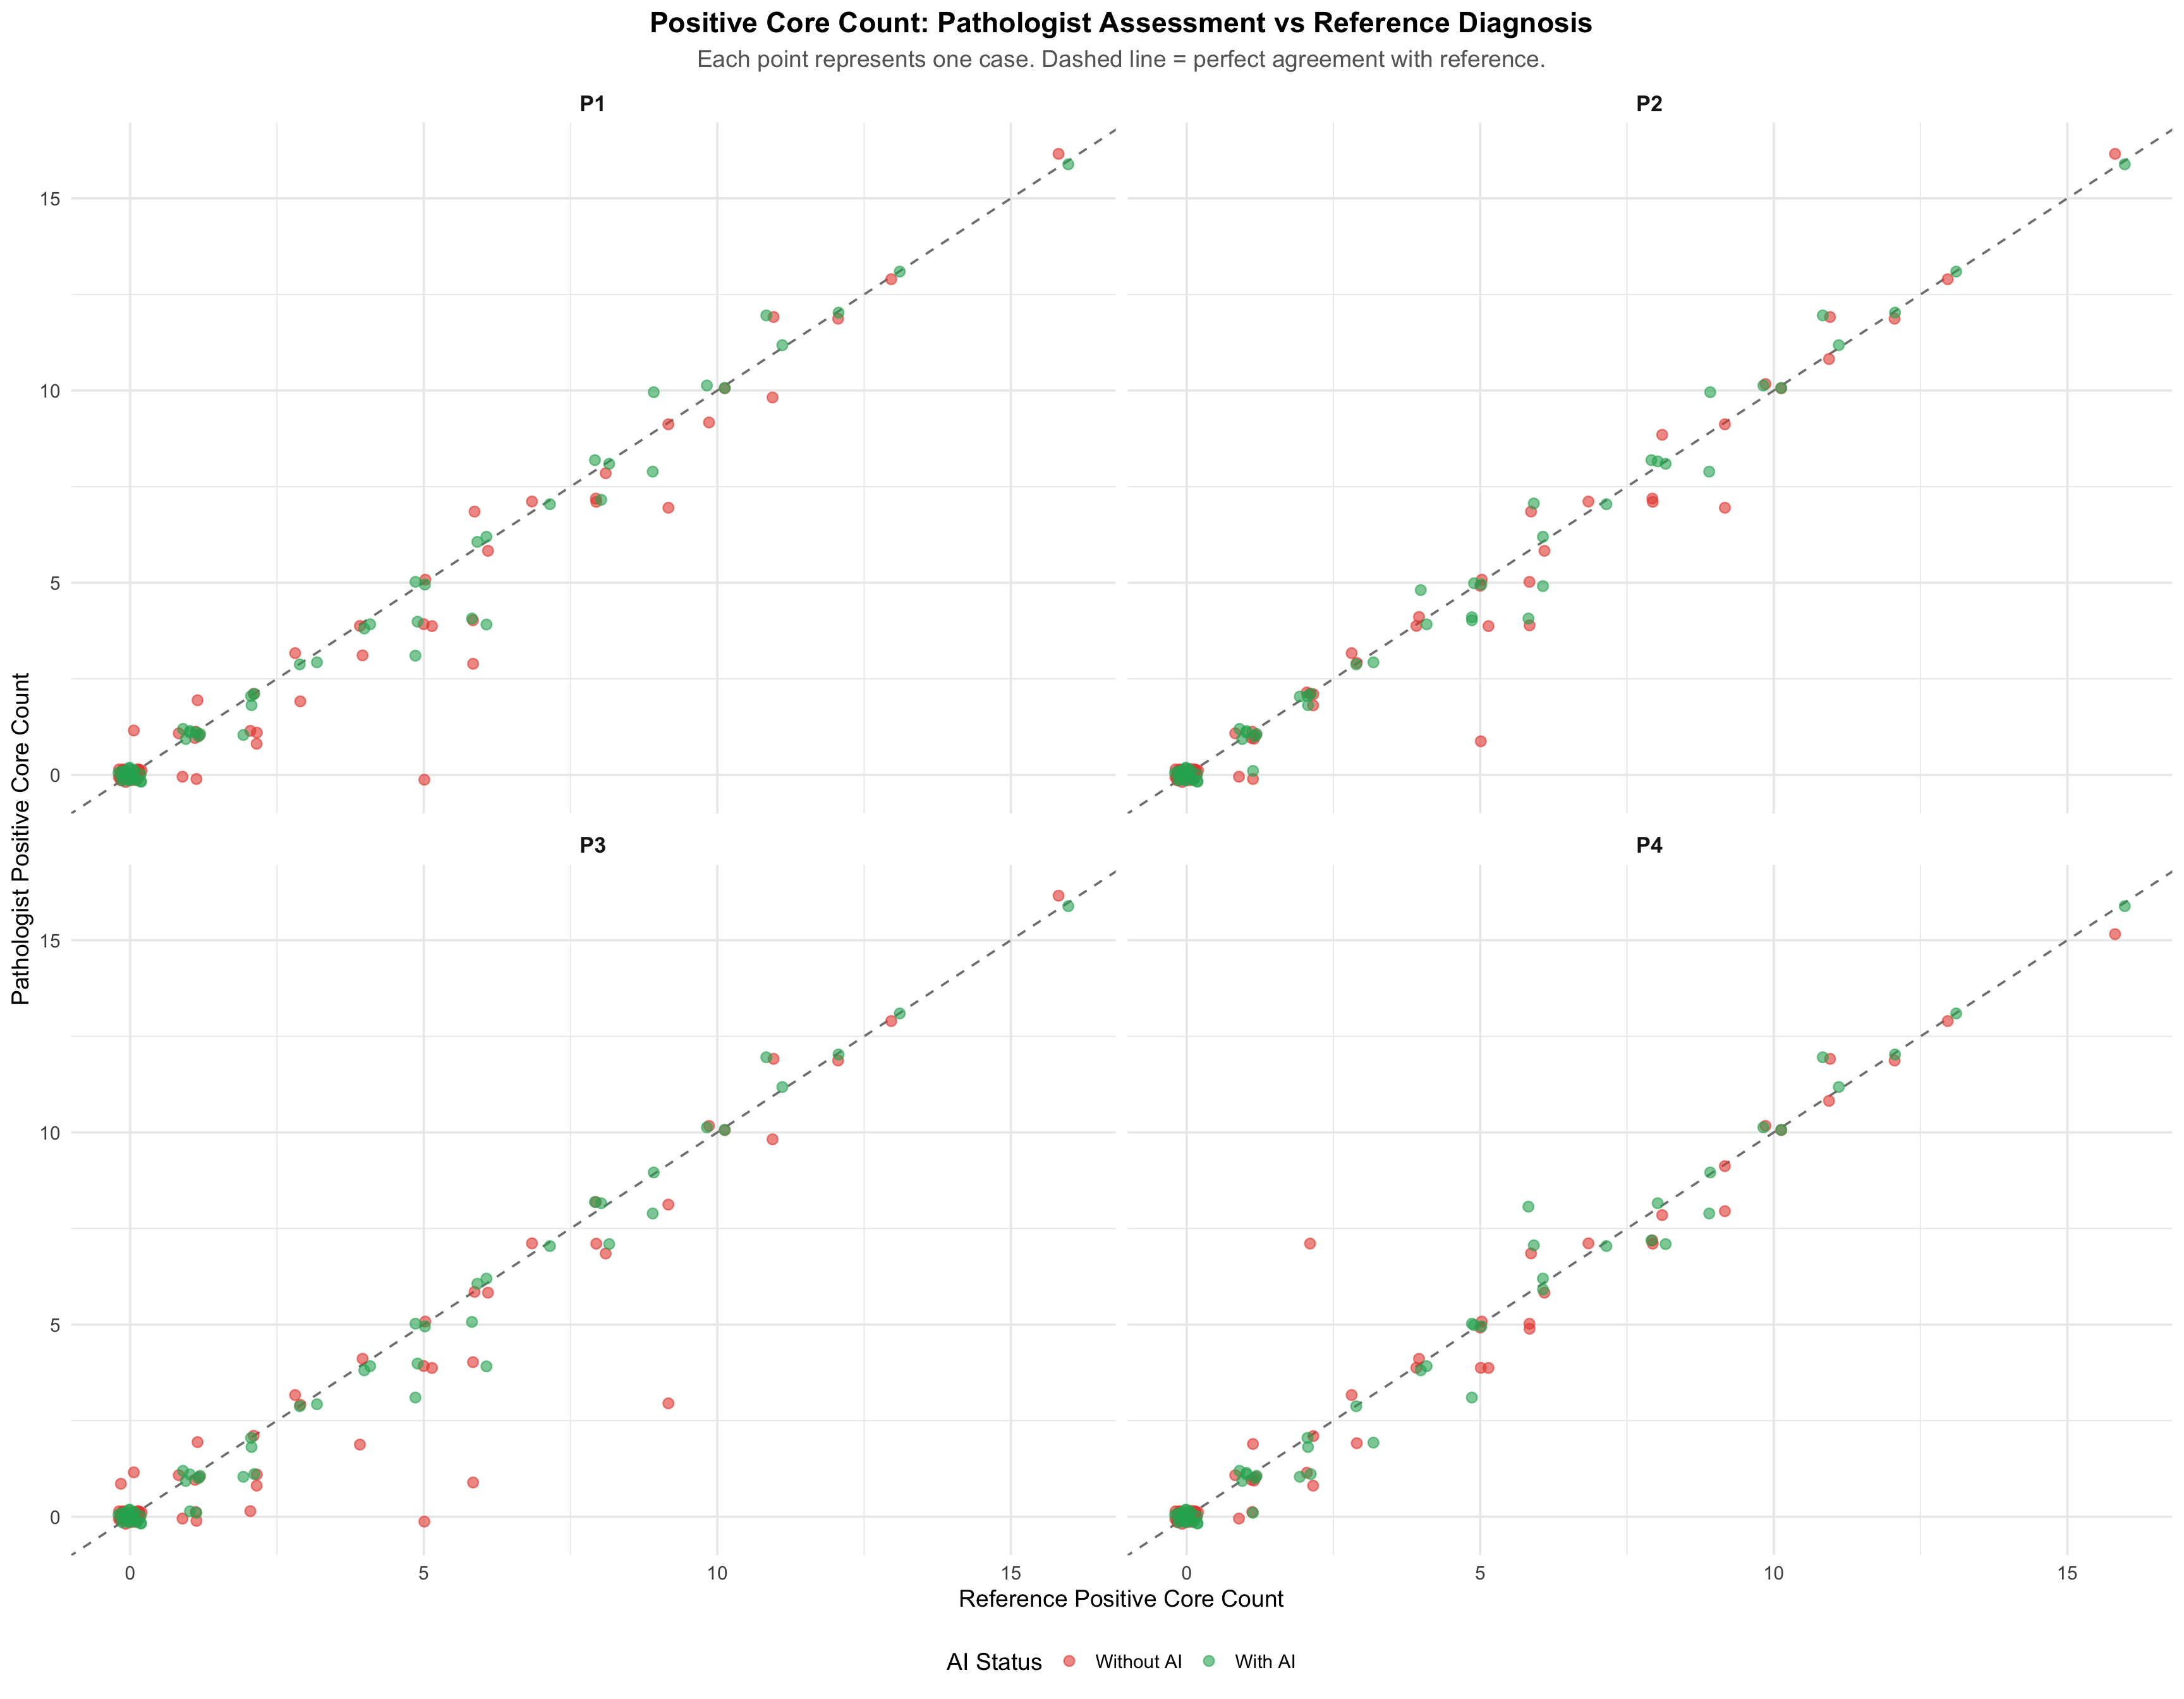
25.5.1 Positive Core Count: Pathologist vs Reference
Note for Pathologists: Scatter plots showing each pathologist’s malignant core count against the reference diagnosis, with and without AI. Points on the diagonal indicate perfect agreement with reference.
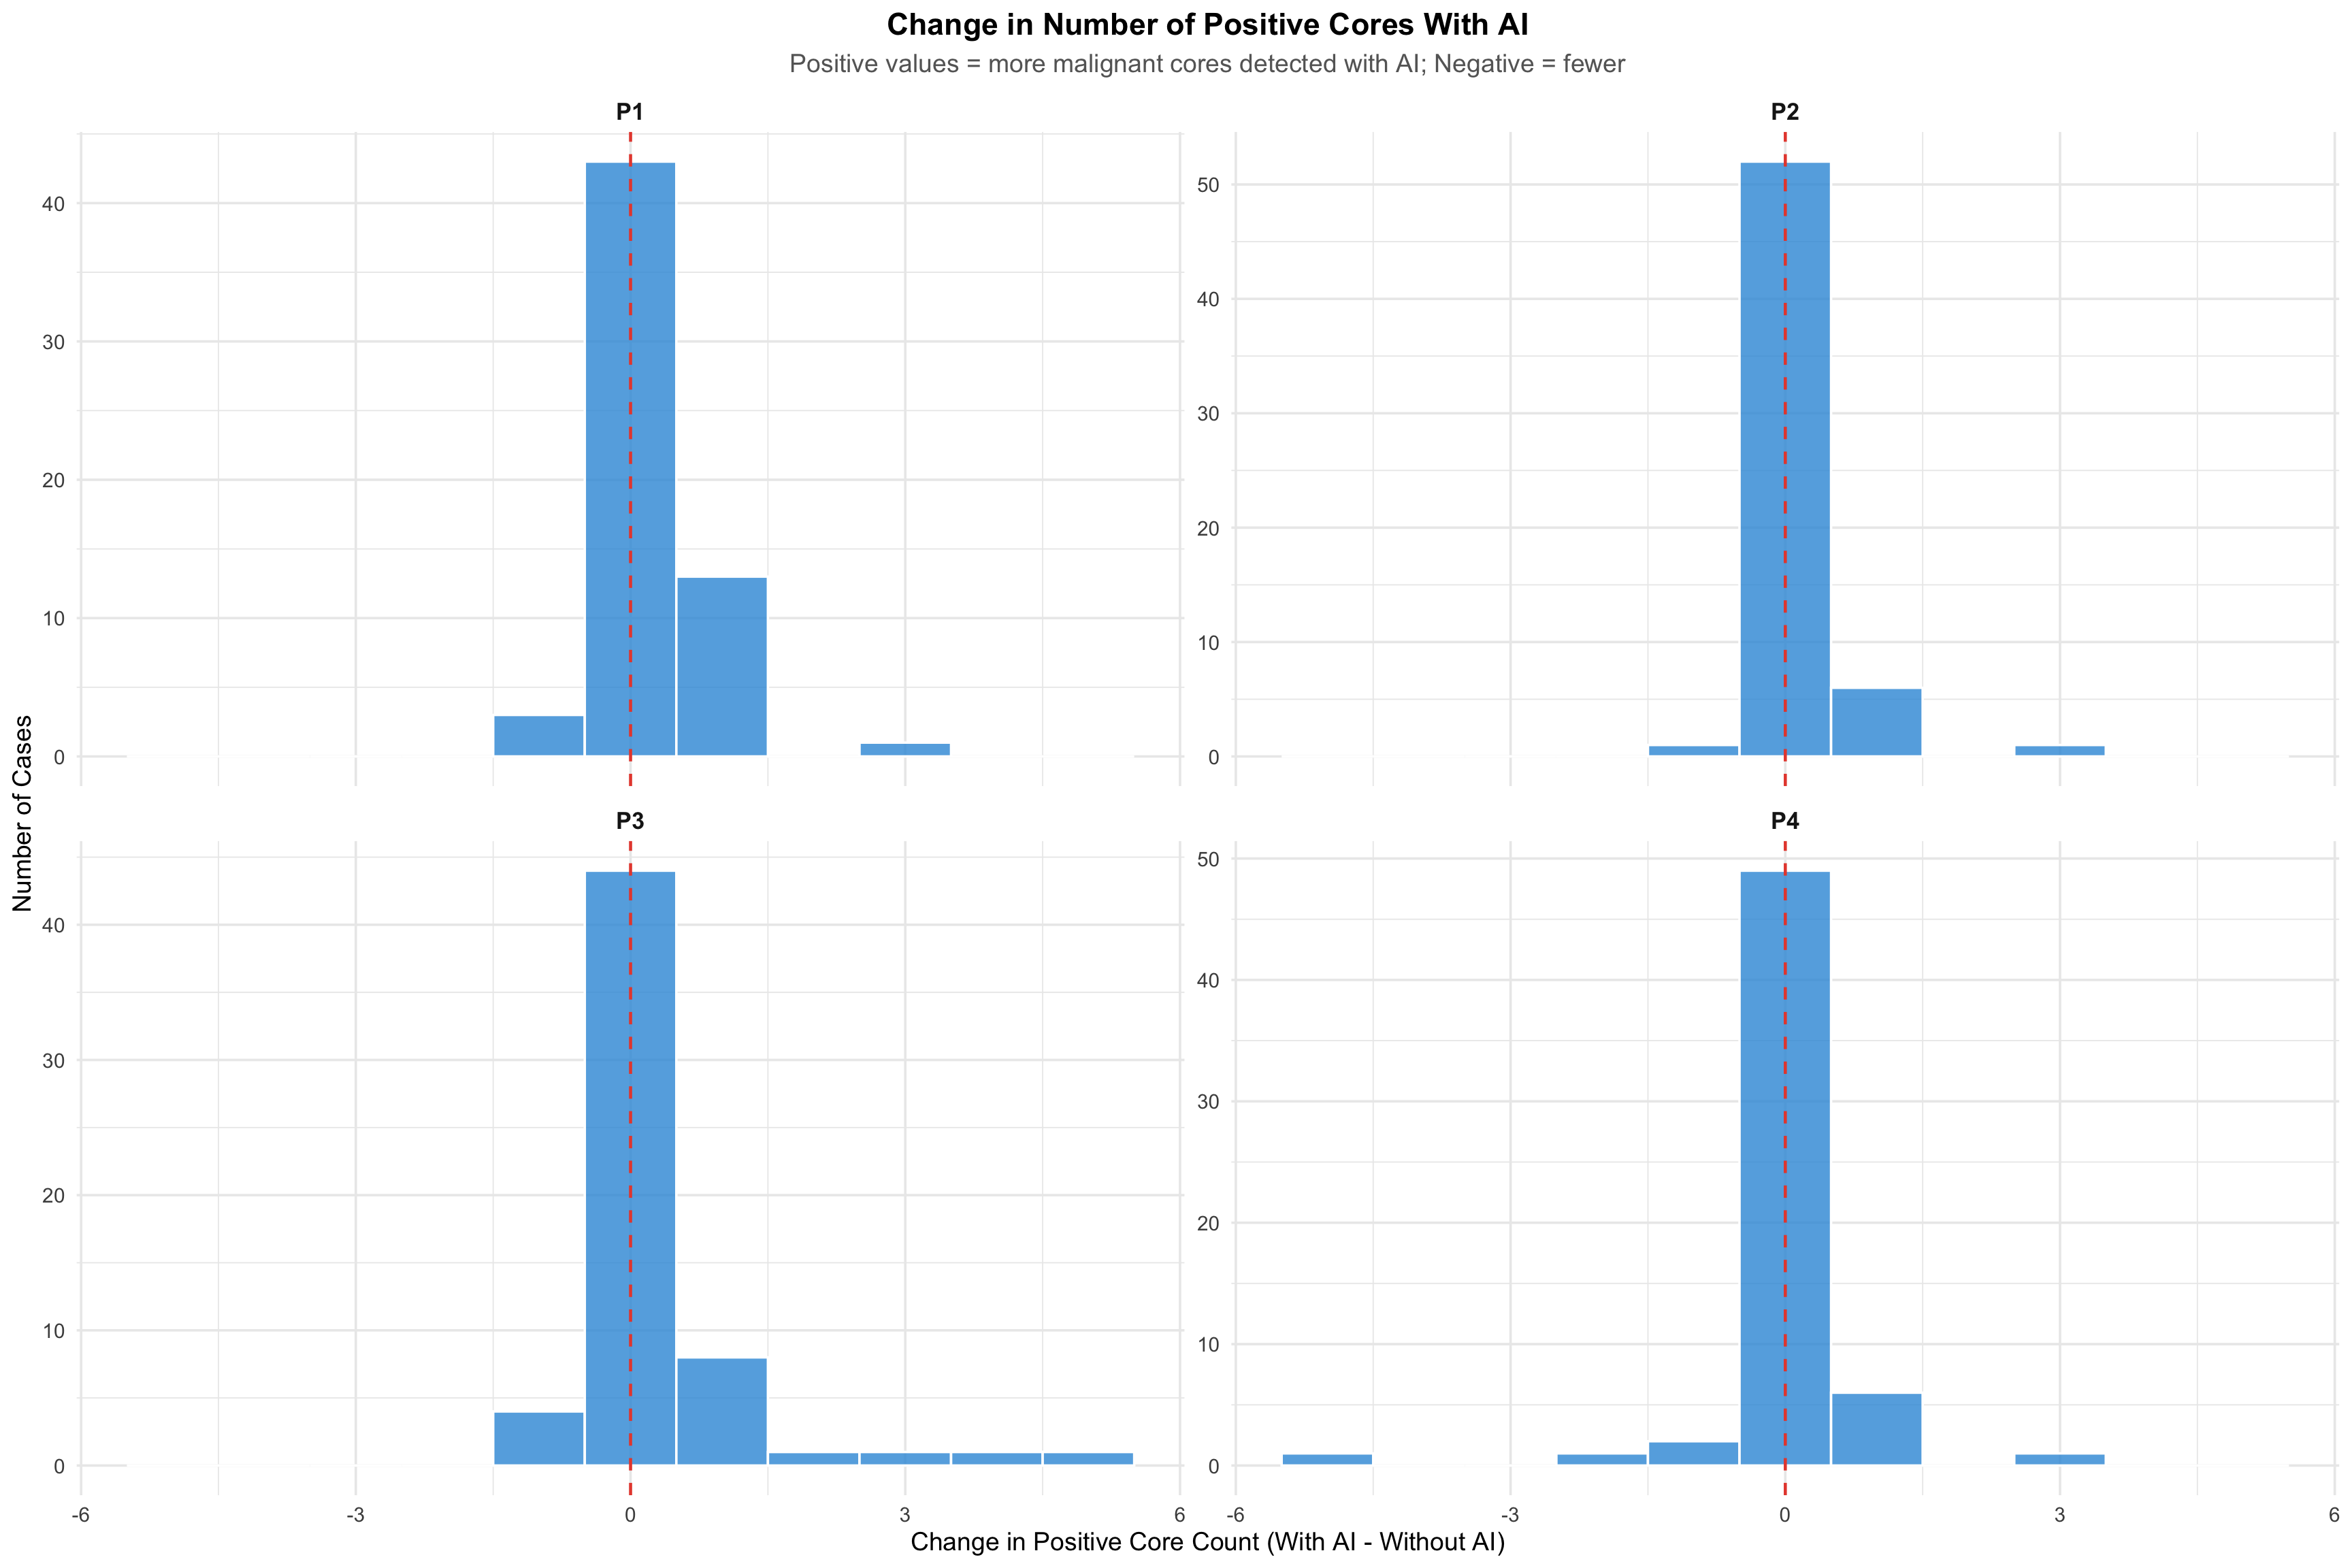
25.5.2 Change in Positive Core Count With AI
Note for Pathologists: Distribution of changes in positive core count when AI was used. Positive values indicate more malignant cores detected with AI.
25.5.3 Category Concordance With Reference (Stacked Bar)
Note for Pathologists: This plot compares the risk-relevant core count category distribution for each pathologist (without and with AI) against the reference diagnosis.
25.6 Summary
Key Findings: AI Impact on Number of Involved Cores
AI improved accuracy of positive core counts vs. reference: Exact match with reference increased from a mean of 70.4% (without AI) to 82.9% (with AI) across all pathologists. Mean absolute error decreased for all pathologists.
AI improved risk-relevant category concordance with reference: Category match with reference increased from 86.7% to 95.0% overall.
When AI changed the core count, the change was overwhelmingly correct: Among cases where the positive core count changed with AI, 75–94% of changes moved the count closer to the reference diagnosis.
Changes were statistically significant for 3 of 4 pathologists (Wilcoxon signed-rank test).
Limitations: Full risk stratification requires PSA level and clinical staging, which were not available in this study. Grade Group data and number of involved cores are the pathology-assessable components that could be evaluated.
This chapter examines whether AI assistance changed the number of involved (malignant) biopsy cores per case, which is a key parameter in prostate cancer risk stratification. According to the AUA/NCCN risk stratification system, the number of positive cores contributes to risk group assignment (e.g., <3 positive cores for Very Low risk; >4 high-grade cores for Very High risk; <50% positive cores for Intermediate-favorable). While PSA and clinical staging data are not available in this study, the pathology-assessable components — number of positive cores, percentage of positive cores, and Grade Group — can be evaluated.