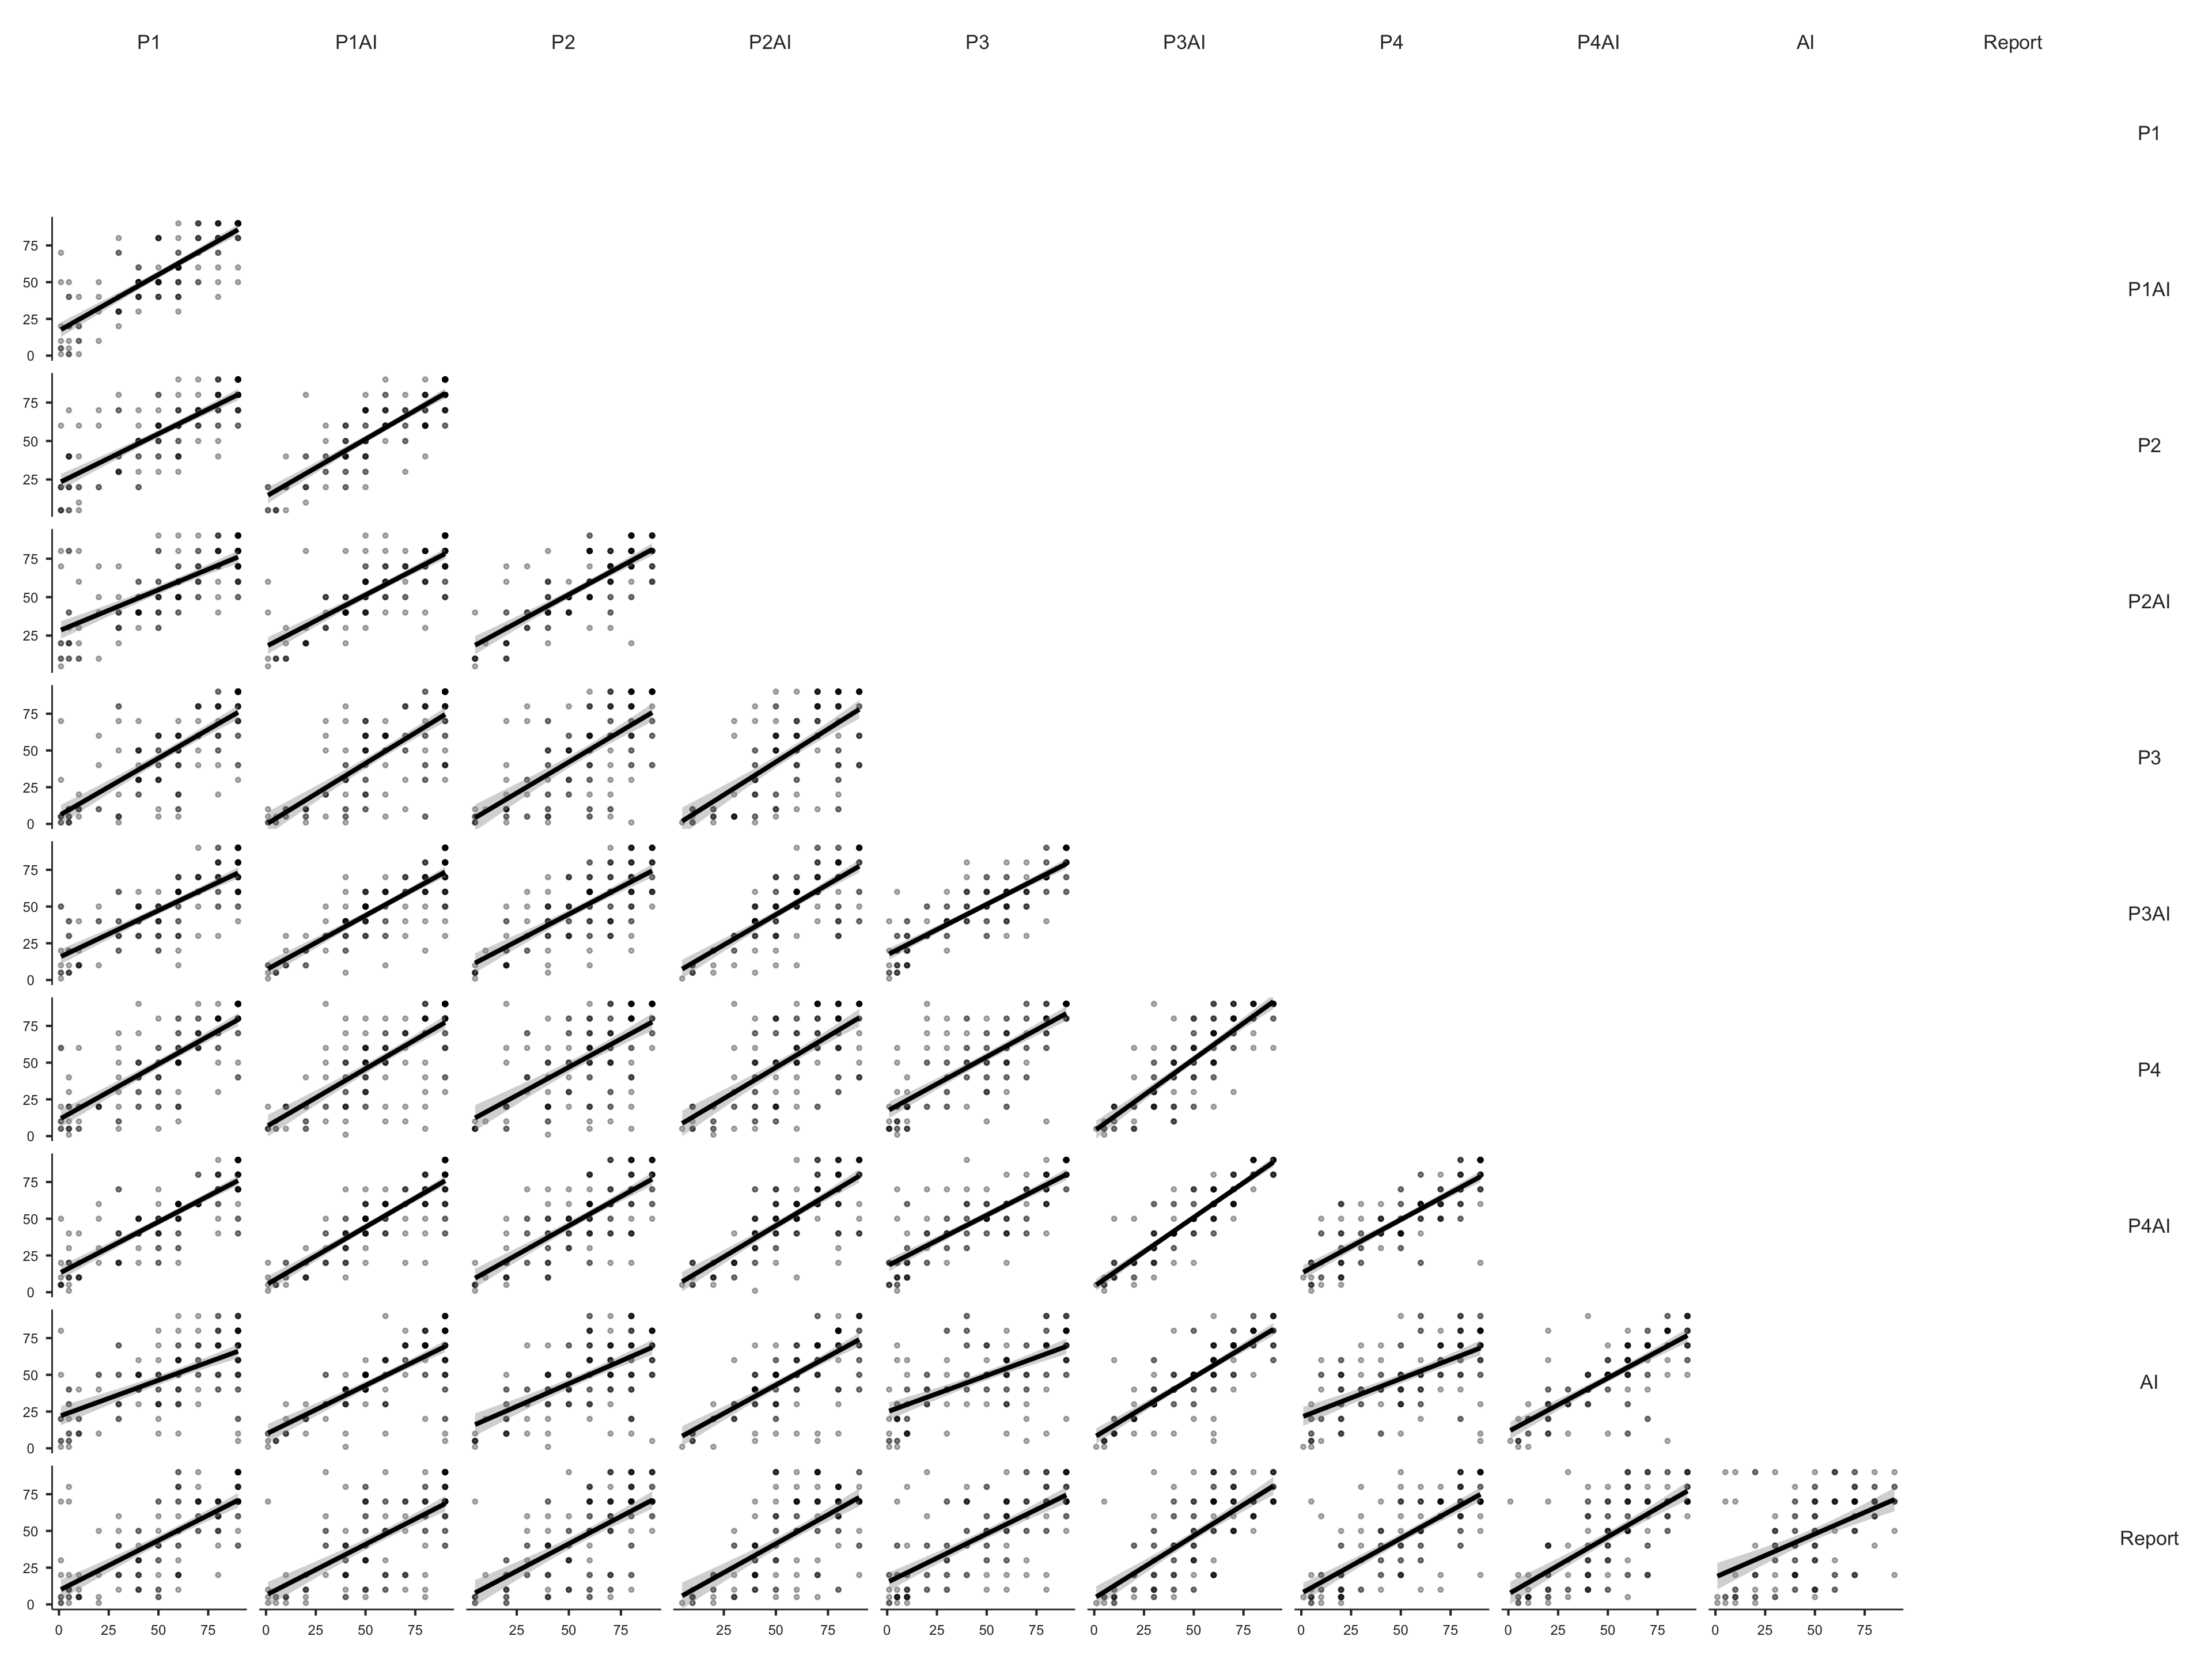
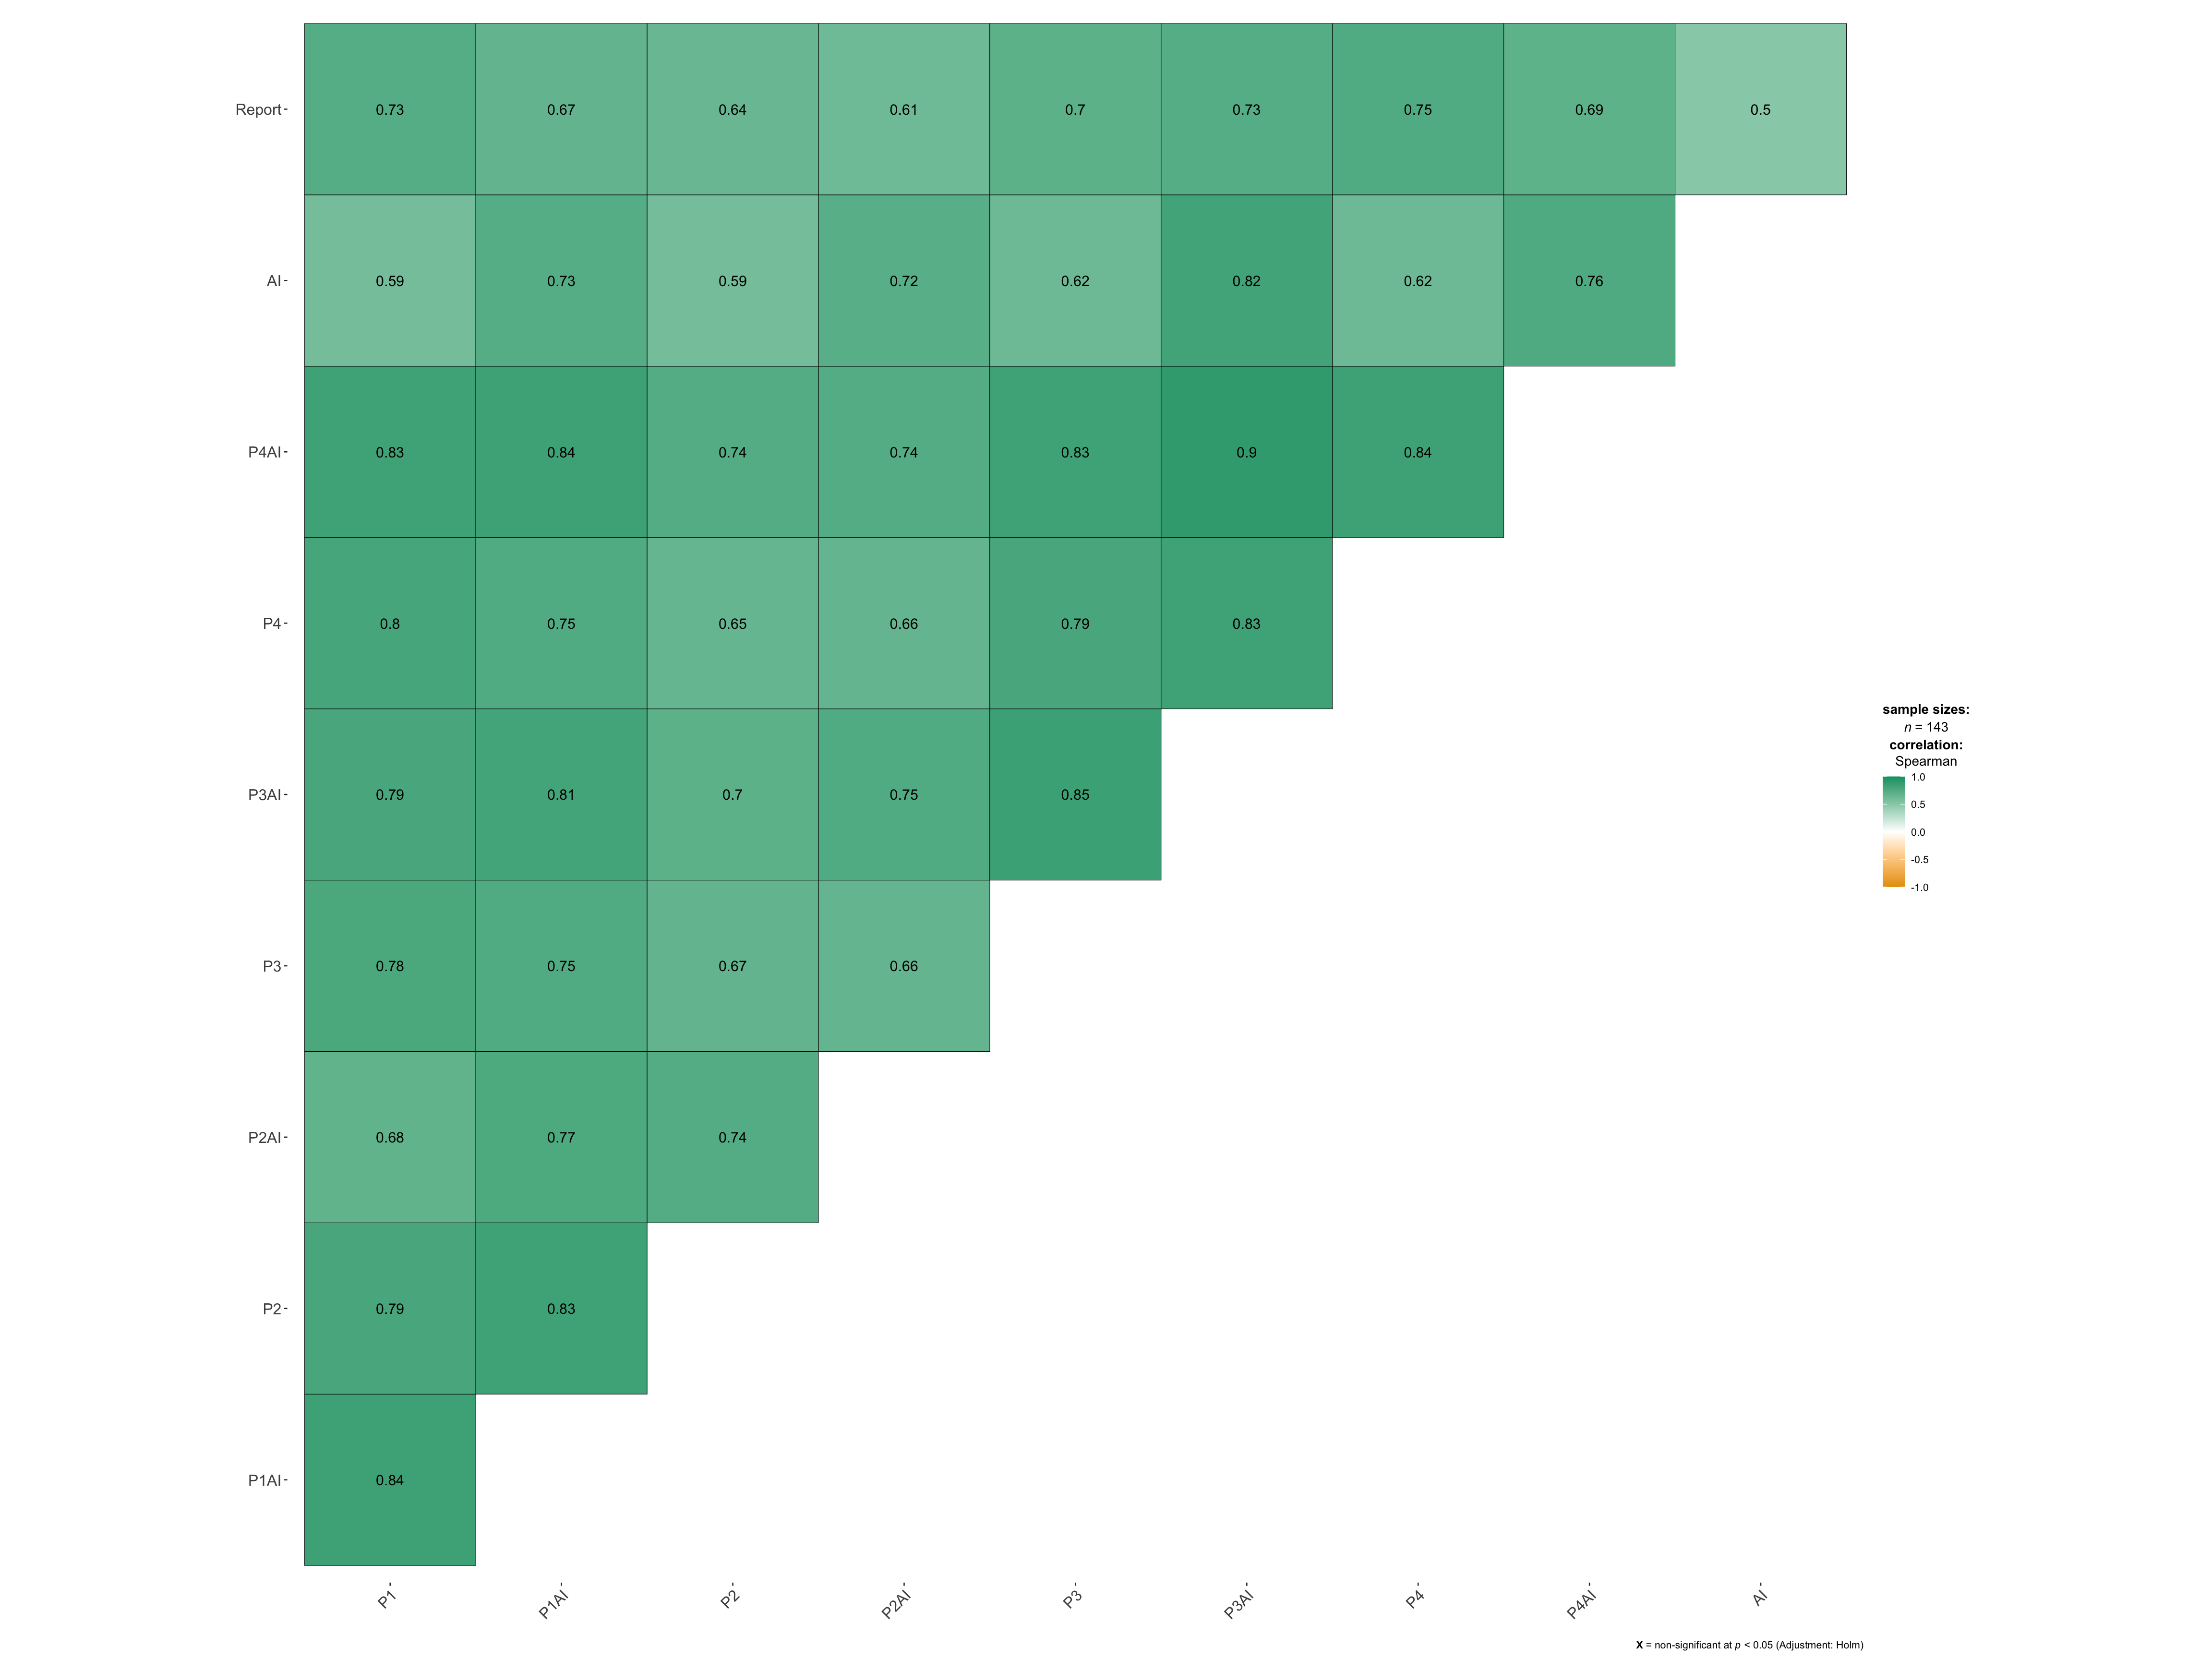
21  Tumor Percent

Note for Pathologists: Correlation matrix showing the strength of association between tumor percentage estimates from different pathologists (P1-P4), with and without AI, along with the AI’s estimation and the original Report.


 CORRELATION MATRIX

 Correlation Matrix                                                                                                                                                   
 ──────────────────────────────────────────────────────────────────────────────────────────────────────────────────────────────────────────────────────────────────── 
                            P1            P1AI          P2            P2AI          P3            P3AI          P4            P4AI          AI            Report      
 ──────────────────────────────────────────────────────────────────────────────────────────────────────────────────────────────────────────────────────────────────── 
   P1        Pearson's r             —                                                                                                                                
             df                      —                                                                                                                                
             p-value                 —                                                                                                                                
                                                                                                                                                                      
   P1AI      Pearson's r     0.8414851             —                                                                                                                  
             df                    141             —                                                                                                                  
             p-value        < .0000001             —                                                                                                                  
                                                                                                                                                                      
   P2        Pearson's r     0.7903762     0.8393161             —                                                                                                    
             df                    141           141             —                                                                                                    
             p-value        < .0000001    < .0000001             —                                                                                                    
                                                                                                                                                                      
   P2AI      Pearson's r     0.6968057     0.7949074     0.7707562             —                                                                                      
             df                    141           141           141             —                                                                                      
             p-value        < .0000001    < .0000001    < .0000001             —                                                                                      
                                                                                                                                                                      
   P3        Pearson's r     0.7734923     0.7473930     0.6720000     0.6785890             —                                                                        
             df                    141           141           141           141             —                                                                        
             p-value        < .0000001    < .0000001    < .0000001    < .0000001             —                                                                        
                                                                                                                                                                      
   P3AI      Pearson's r     0.7885888     0.8291146     0.7332897     0.7780389     0.8576700             —                                                          
             df                    141           141           141           141           141             —                                                          
             p-value        < .0000001    < .0000001    < .0000001    < .0000001    < .0000001             —                                                          
                                                                                                                                                                      
   P4        Pearson's r     0.7900237     0.7503409     0.6476046     0.6783468     0.7796931     0.8305176             —                                            
             df                    141           141           141           141           141           141             —                                            
             p-value        < .0000001    < .0000001    < .0000001    < .0000001    < .0000001    < .0000001             —                                            
                                                                                                                                                                      
   P4AI      Pearson's r     0.8365624     0.8521071     0.7618832     0.7719739     0.8317692     0.9067737     0.8321862             —                              
             df                    141           141           141           141           141           141           141             —                              
             p-value        < .0000001    < .0000001    < .0000001    < .0000001    < .0000001    < .0000001    < .0000001             —                              
                                                                                                                                                                      
   AI        Pearson's r     0.6122889     0.7479310     0.6193597     0.7357687     0.6208535     0.8221419     0.6211334     0.7580663             —                
             df                    141           141           141           141           141           141           141           141             —                
             p-value        < .0000001    < .0000001    < .0000001    < .0000001    < .0000001    < .0000001    < .0000001    < .0000001             —                
                                                                                                                                                                      
   Report    Pearson's r     0.7241734     0.6657102     0.6355671     0.6404549     0.7085657     0.7305564     0.7590290     0.6942211     0.5009384            —   
             df                    141           141           141           141           141           141           141           141           141            —   
             p-value        < .0000001    < .0000001    < .0000001    < .0000001    < .0000001    < .0000001    < .0000001    < .0000001    < .0000001            —   
 ──────────────────────────────────────────────────────────────────────────────────────────────────────────────────────────────────────────────────────────────────── 
   Note. Hₐ is positive correlation
   Note. * p < .05, ** p < .01, *** p < .001, one-tailed

Note for Pathologists: Visualization of the correlation in tumor percentage estimates. Higher correlation coefficients (closer to 1.0) indicate stronger agreement between the observers/AI.