5 Performance Metrics Analysis
6 Performance Metrics Analysis
6.1 AI Performance Metrics
6.1.1 Phase 1: AI vs Report Diagnosis
AI Performance Against Original Report Diagnoses
This analysis compares AI predictions with the original pathology report diagnoses from Phase 1 of the study.
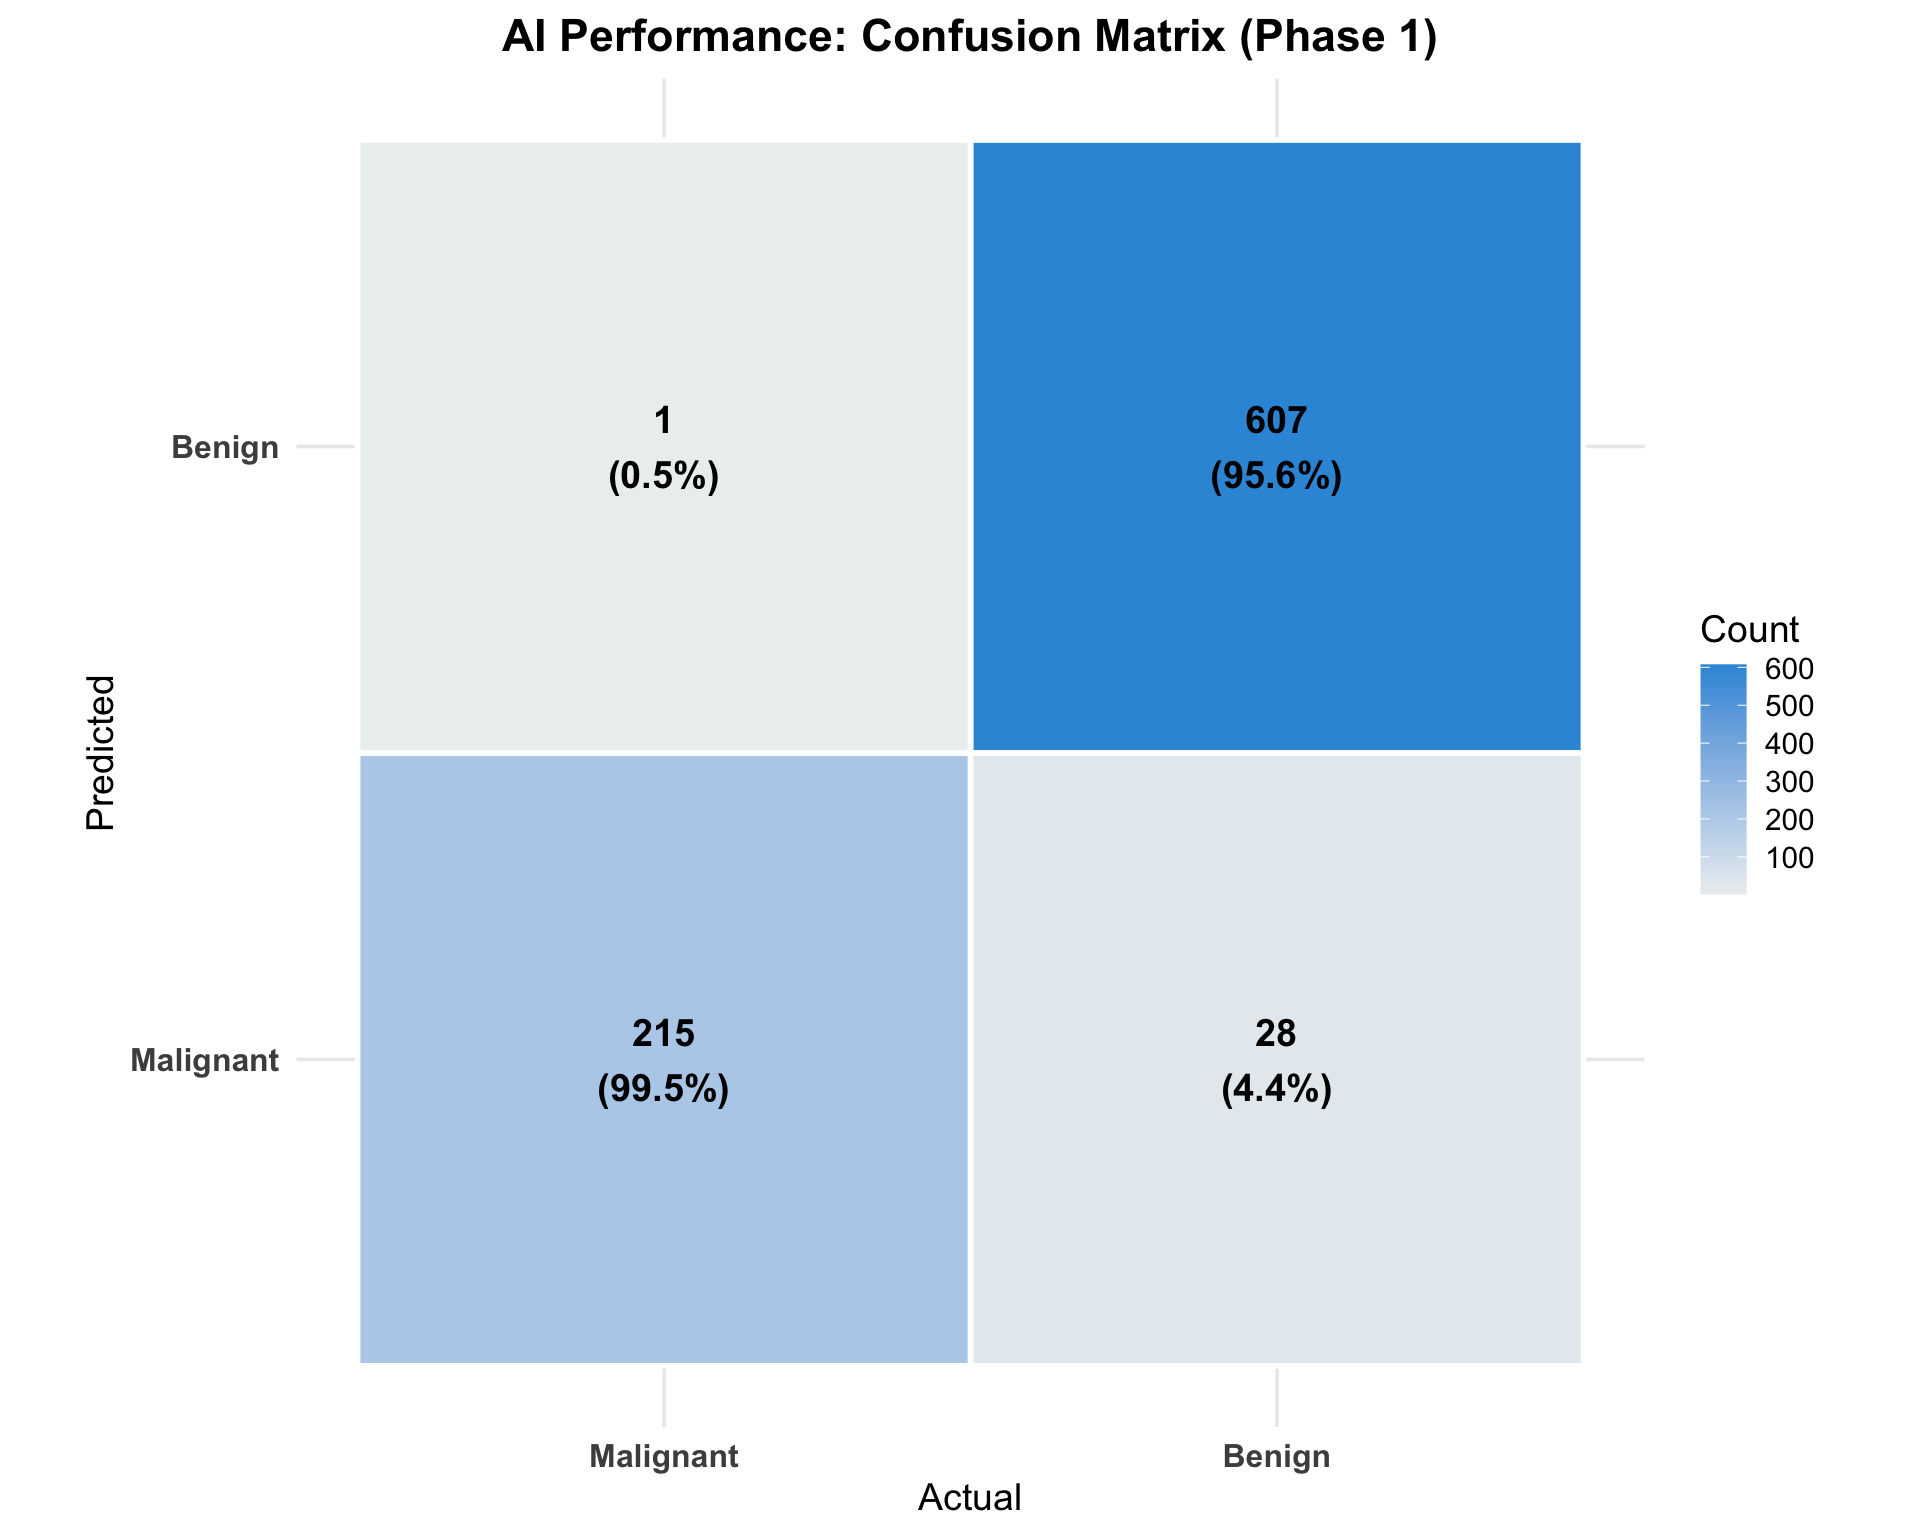
6.1.2 Confusion Matrix: AI vs Report
Note for Pathologists: This confusion matrix visualizes the matches and mismatches between AI predictions and Phase 1 report diagnoses.
| Malignant | Benign | |
|---|---|---|
| Malignant | 215 | 28 |
| Benign | 1 | 607 |
6.1.3 Performance Metrics
Note for Pathologists: This table evaluates the AI’s standalone performance against the original pathology report diagnoses from Phase 1.
| Metric | Estimate | Lower_CI | Upper_CI |
|---|---|---|---|
| Sensitivity | 0.995 | 0.974 | 1.000 |
| Specificity | 0.956 | 0.937 | 0.971 |
| PPV | 0.885 | 0.838 | 0.922 |
| NPV | 0.998 | 0.991 | 1.000 |
| Accuracy | 0.966 | NA | NA |
6.2 Pathologist Performance Metrics
6.2.1 Individual Pathologist Performance (Phase 2)
6.2.1.1 Without AI
Pathologist Performance Without AI Assistance
Evaluating each pathologist’s diagnostic accuracy without AI, using the research consensus diagnosis as reference diagnosis.
Note for Pathologists: Detailed sensitivity, specificity, and accuracy metrics for each pathologist’s unaided evaluation (Phase 2) against the research consensus (Reference Diagnosis).
| Pathologist | Sensitivity | Sensitivity_Lower | Sensitivity_Upper | Specificity | Specificity_Lower | Specificity_Upper | PPV | NPV | Accuracy |
|---|---|---|---|---|---|---|---|---|---|
| P1_noAI | 0.868 | 0.814 | 0.911 | 0.990 | 0.978 | 0.996 | 0.967 | 0.957 | 0.959 |
| P2_noAI | 0.922 | 0.876 | 0.955 | 0.992 | 0.981 | 0.997 | 0.974 | 0.974 | 0.974 |
| P3_noAI | 0.829 | 0.771 | 0.878 | 0.990 | 0.978 | 0.996 | 0.966 | 0.945 | 0.949 |
| P4_noAI | 0.927 | 0.882 | 0.958 | 0.983 | 0.970 | 0.992 | 0.950 | 0.975 | 0.969 |
6.2.1.2 With AI
Pathologist Performance With AI Assistance
Evaluating each pathologist’s diagnostic accuracy with AI assistance, using the research consensus diagnosis as reference diagnosis.
Note for Pathologists: Performance metrics for each pathologist when assisted by AI.
| Pathologist | Sensitivity | Sensitivity_Lower | Sensitivity_Upper | Specificity | Specificity_Lower | Specificity_Upper | PPV | NPV | Accuracy |
|---|---|---|---|---|---|---|---|---|---|
| P1_withAI | 0.946 | 0.906 | 0.973 | 0.995 | 0.986 | 0.999 | 0.985 | 0.982 | 0.983 |
| P2_withAI | 0.961 | 0.925 | 0.983 | 0.992 | 0.981 | 0.997 | 0.975 | 0.987 | 0.984 |
| P3_withAI | 0.927 | 0.882 | 0.958 | 0.993 | 0.983 | 0.998 | 0.979 | 0.976 | 0.977 |
| P4_withAI | 0.941 | 0.900 | 0.969 | 0.988 | 0.976 | 0.995 | 0.965 | 0.980 | 0.977 |
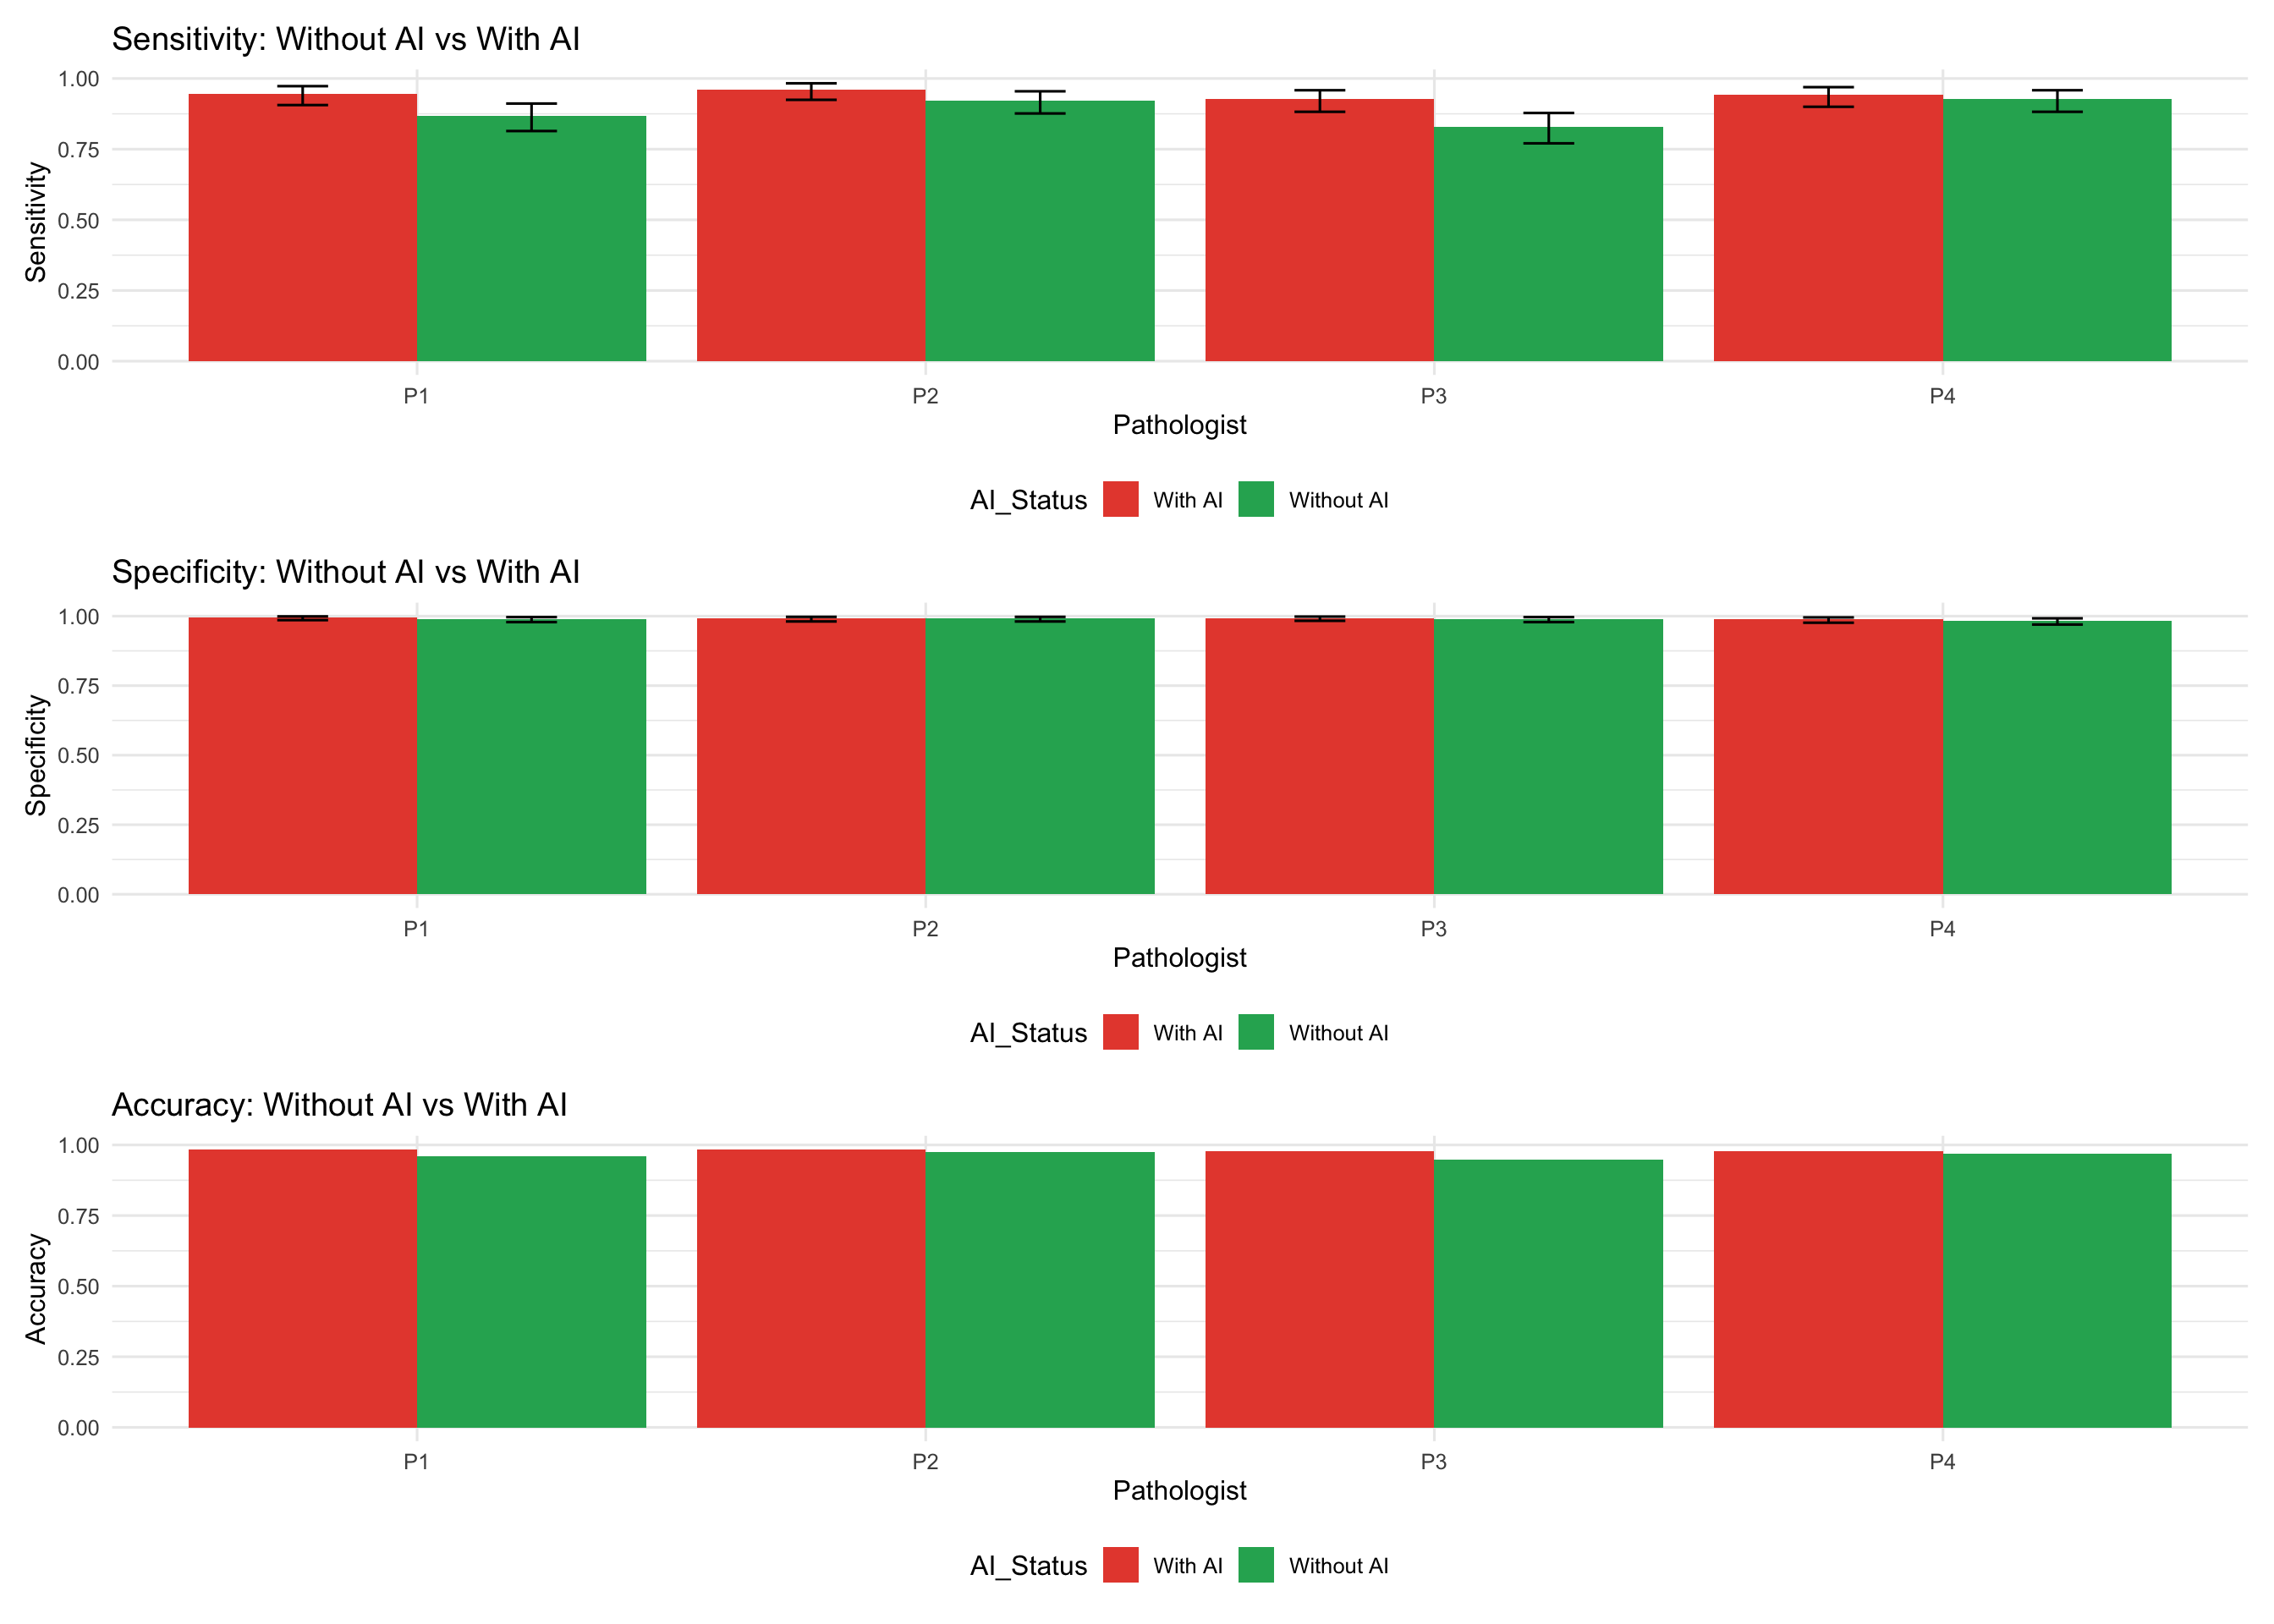
6.2.2 Comparison: Performance Change with AI
Impact of AI on Pathologist Performance
This analysis compares diagnostic performance metrics before and after AI assistance to quantify the improvement or change in accuracy.
Note for Pathologists: This comparison highlights the absolute change in sensitivity, specificity, and accuracy for each pathologist when using AI.
| Pathologist | Sensitivity_Without AI | Sensitivity_With AI | Specificity_Without AI | Specificity_With AI | Accuracy_Without AI | Accuracy_With AI | Sensitivity_Change | Specificity_Change | Accuracy_Change |
|---|---|---|---|---|---|---|---|---|---|
| P1 | 0.868 | 0.946 | 0.990 | 0.995 | 0.959 | 0.983 | 0.078 | 0.005 | 0.024 |
| P2 | 0.922 | 0.961 | 0.992 | 0.992 | 0.974 | 0.984 | 0.039 | 0.000 | 0.010 |
| P3 | 0.829 | 0.927 | 0.990 | 0.993 | 0.949 | 0.977 | 0.098 | 0.003 | 0.027 |
| P4 | 0.927 | 0.941 | 0.983 | 0.988 | 0.969 | 0.977 | 0.015 | 0.005 | 0.007 |
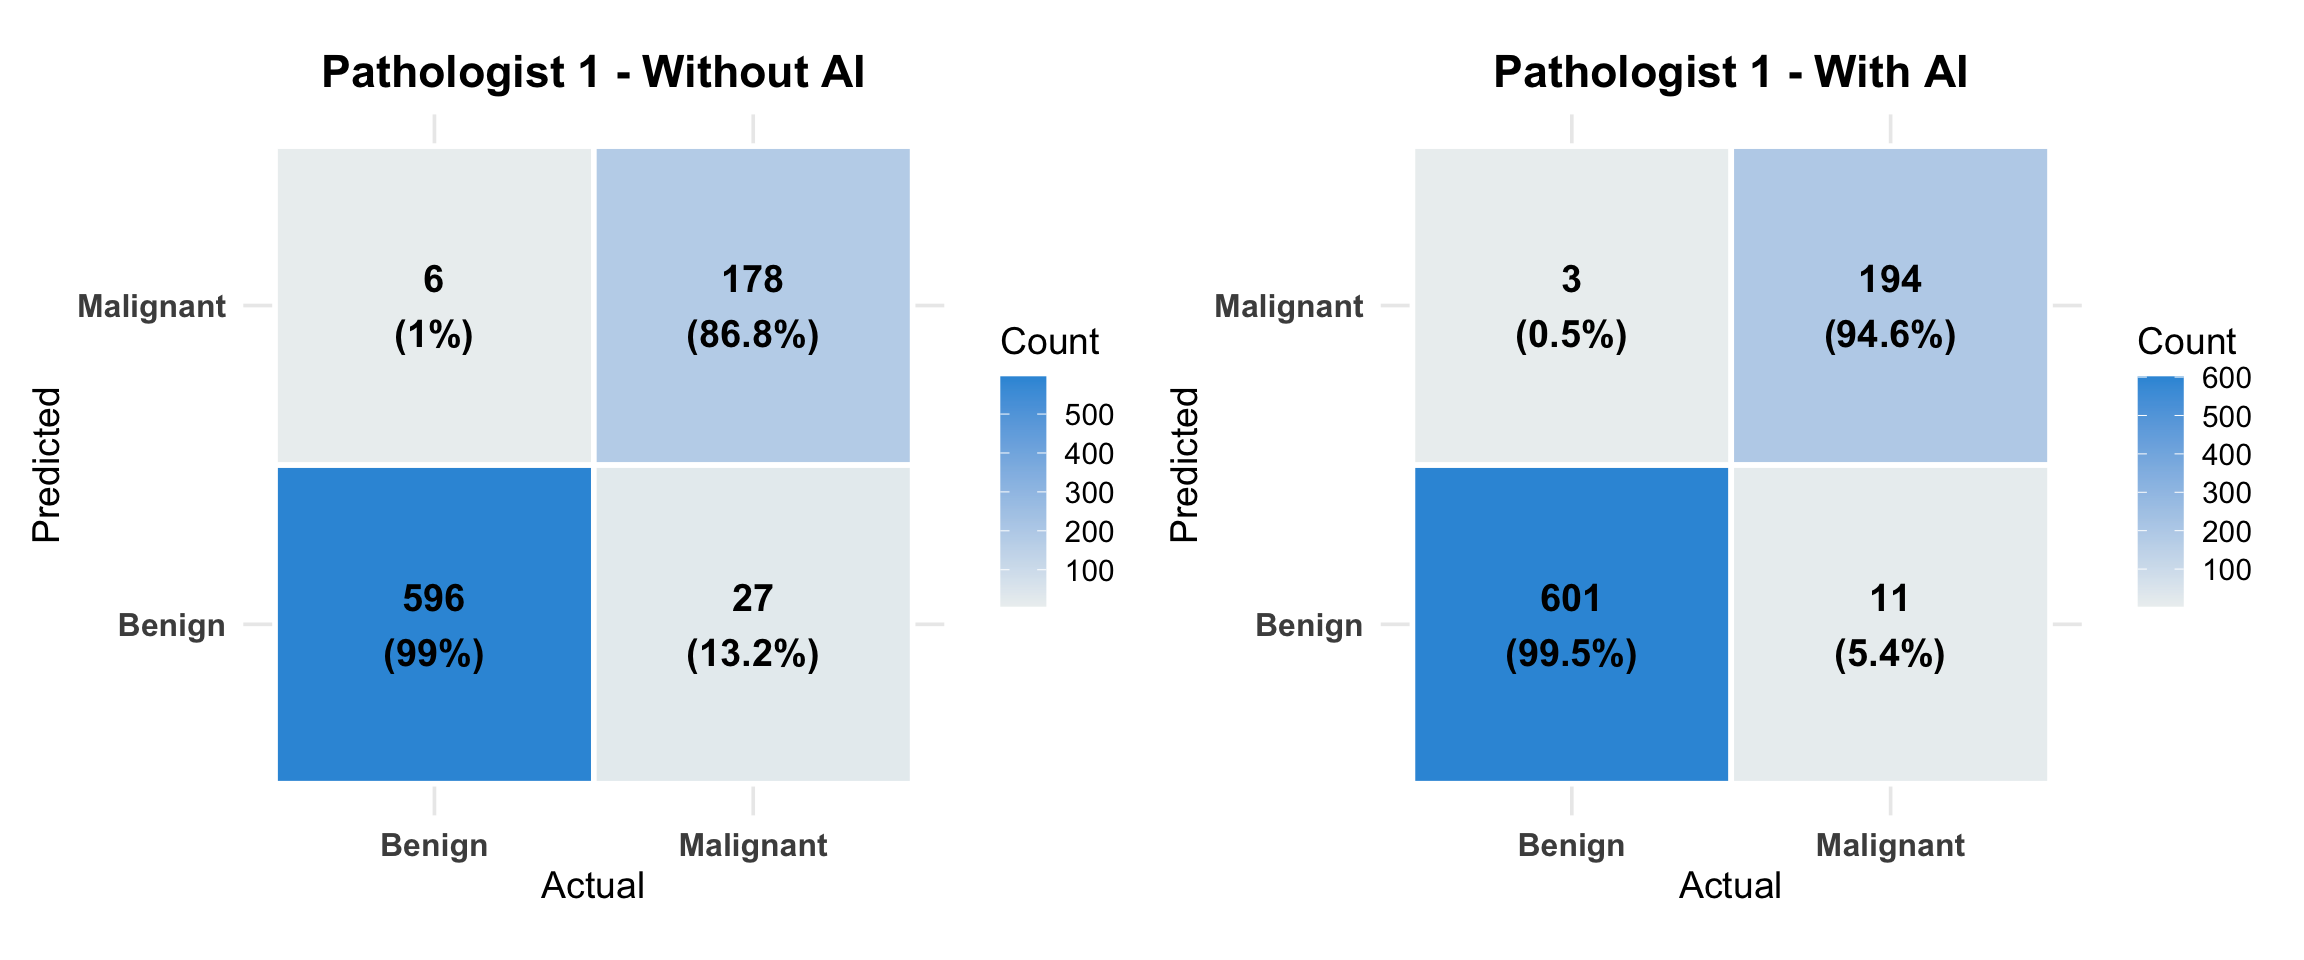
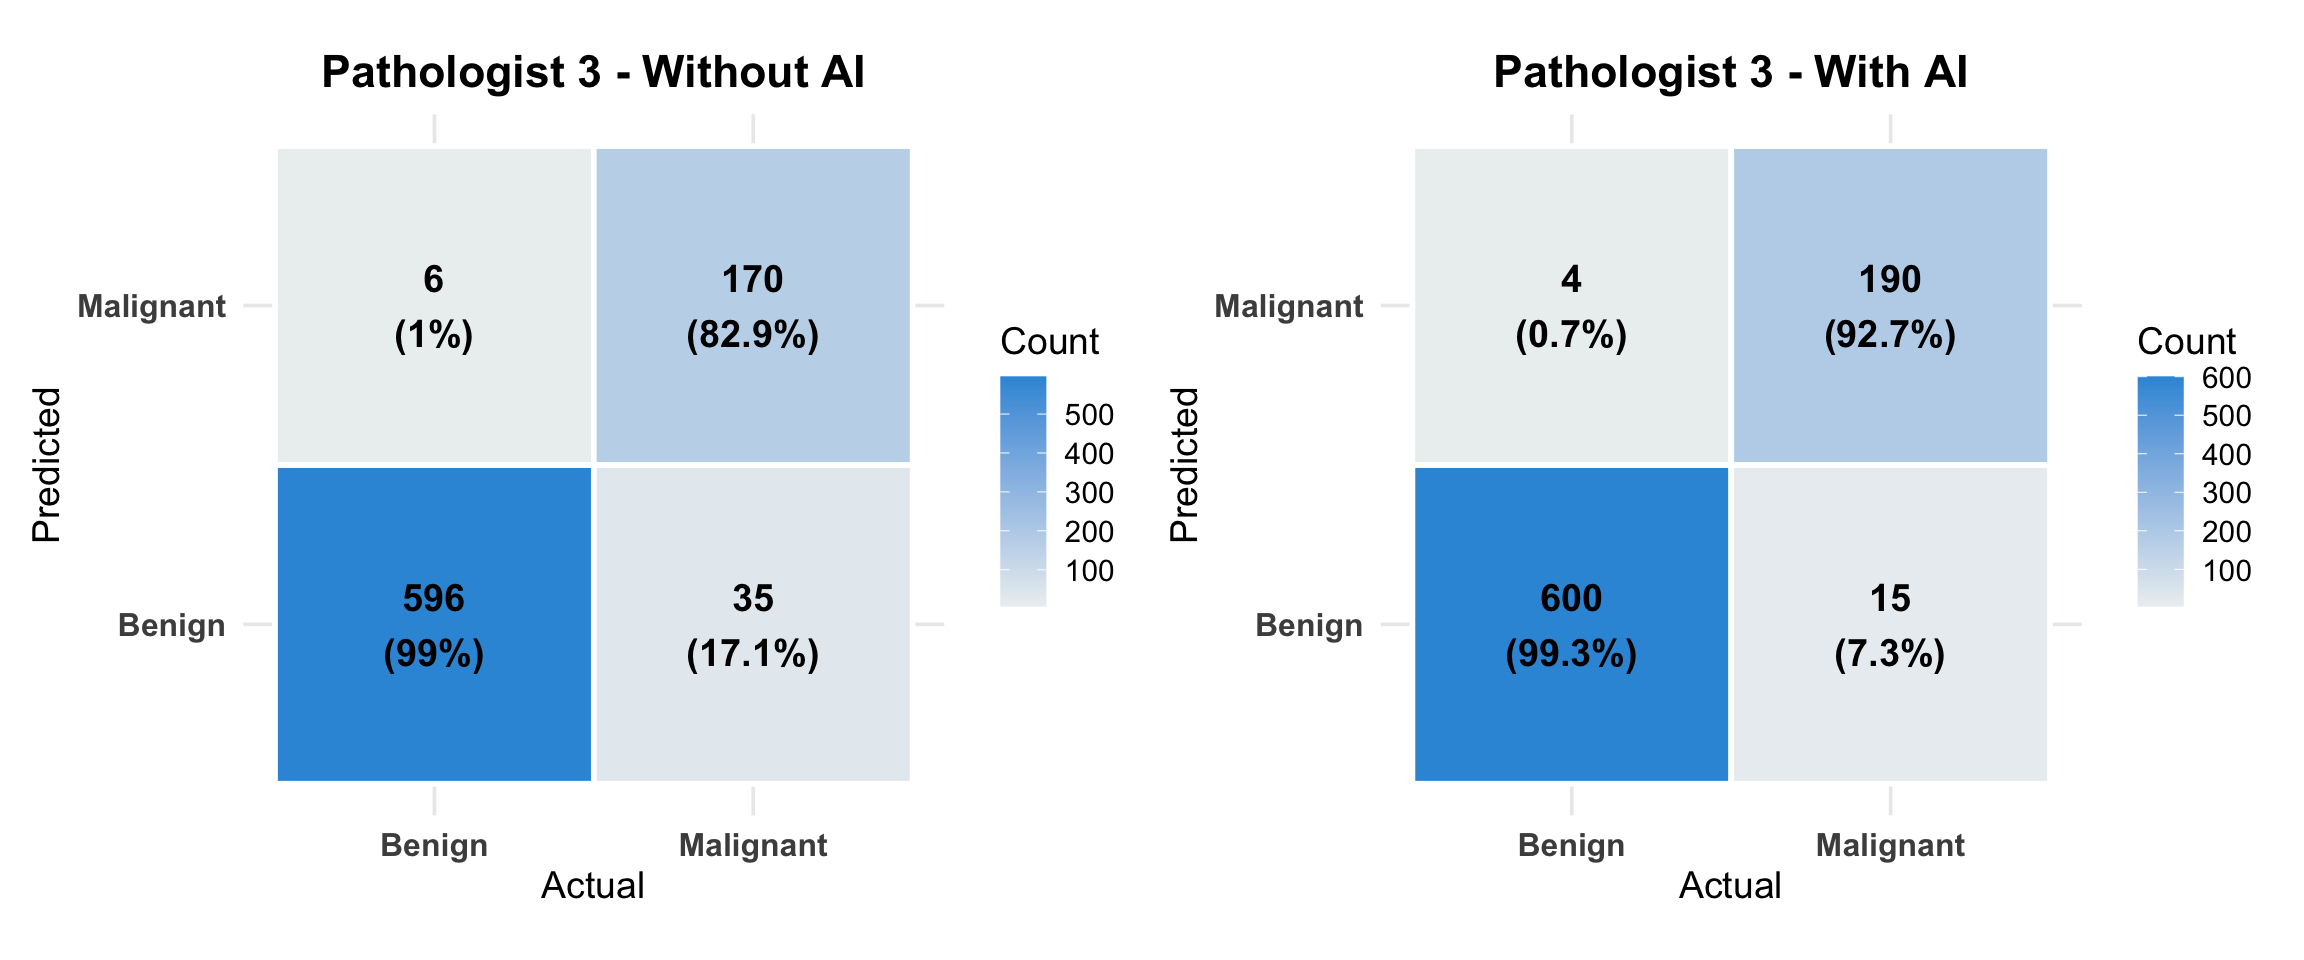
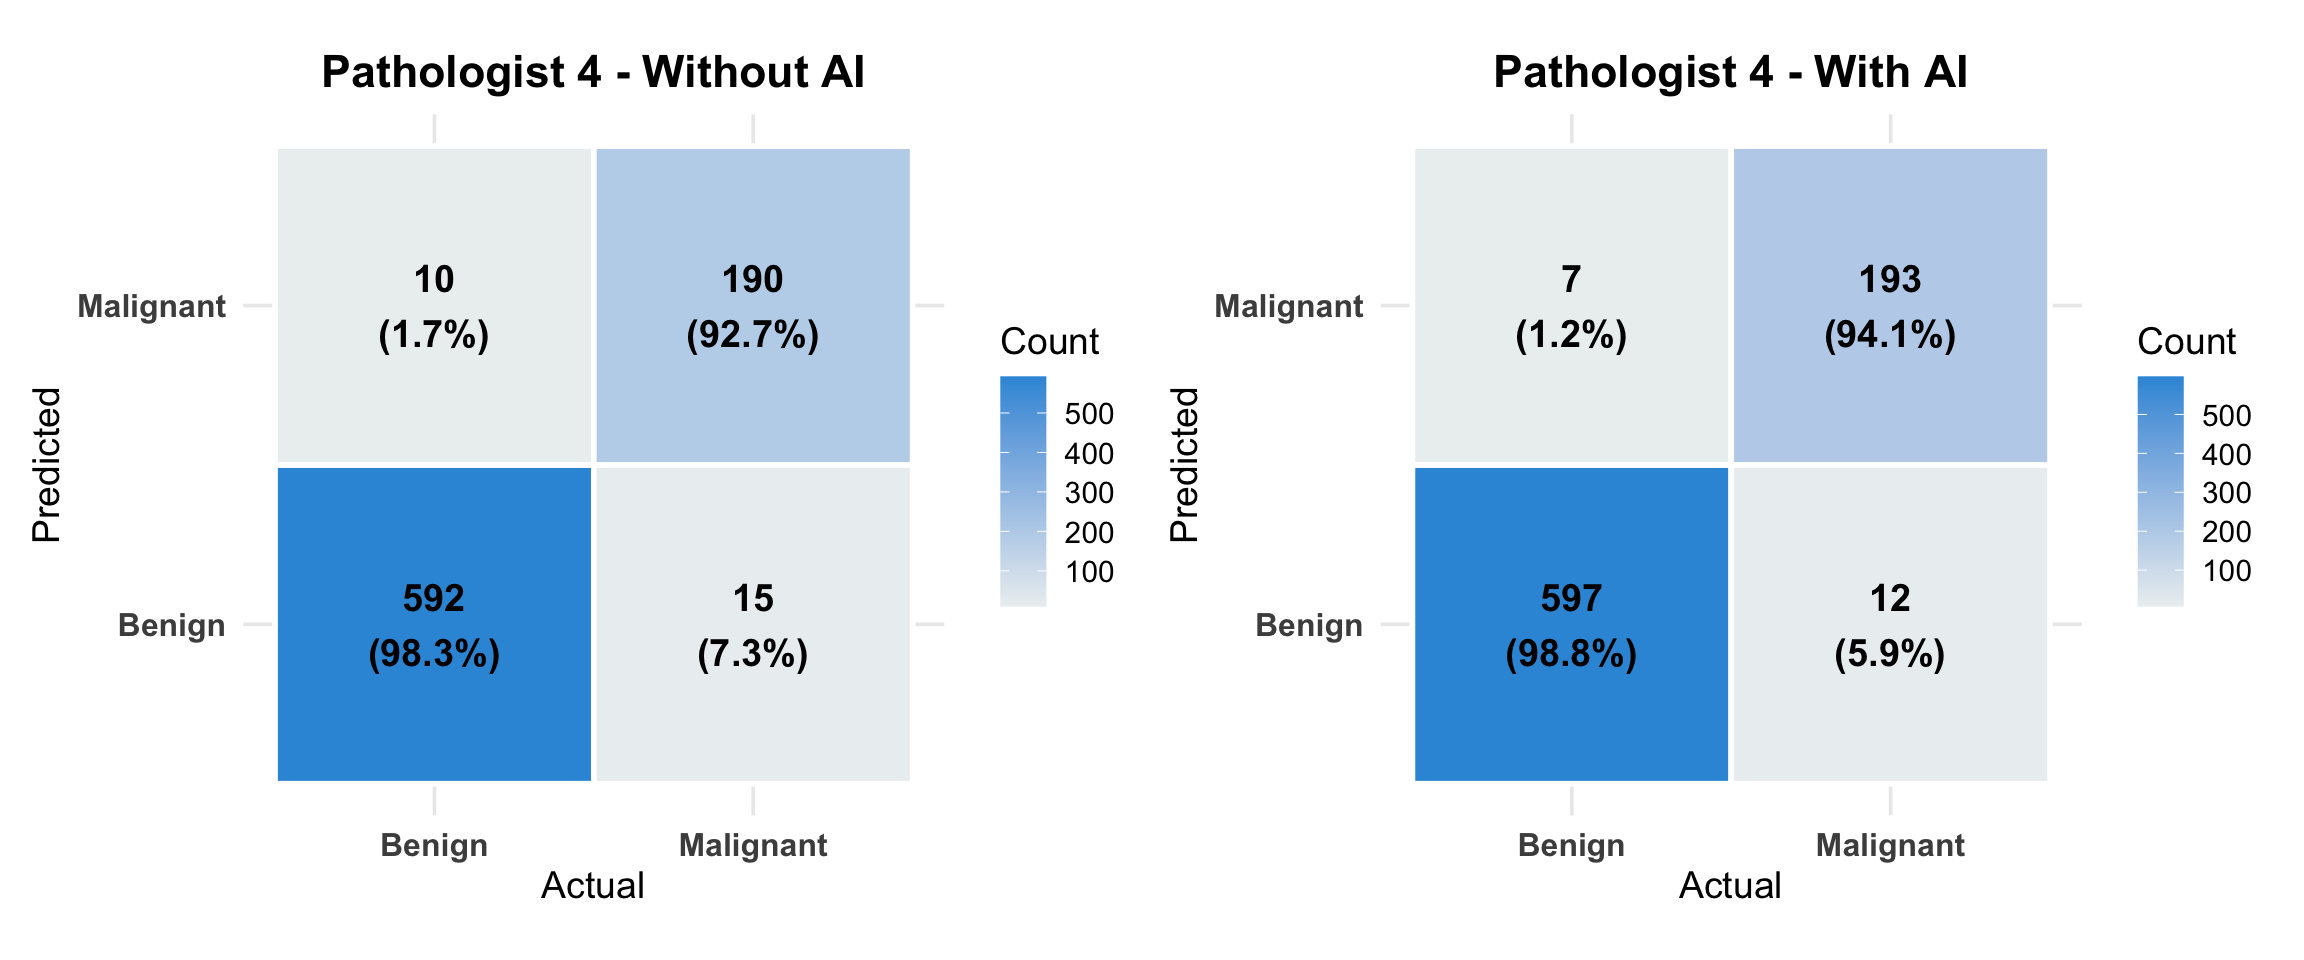
6.3 Detailed Confusion Matrices
6.3.1 Pathologist 1
Note for Pathologists: Detailed breakdown of true/false positives and negatives for each pathologist, comparing ‘No AI’ vs ‘With AI’ scenarios.
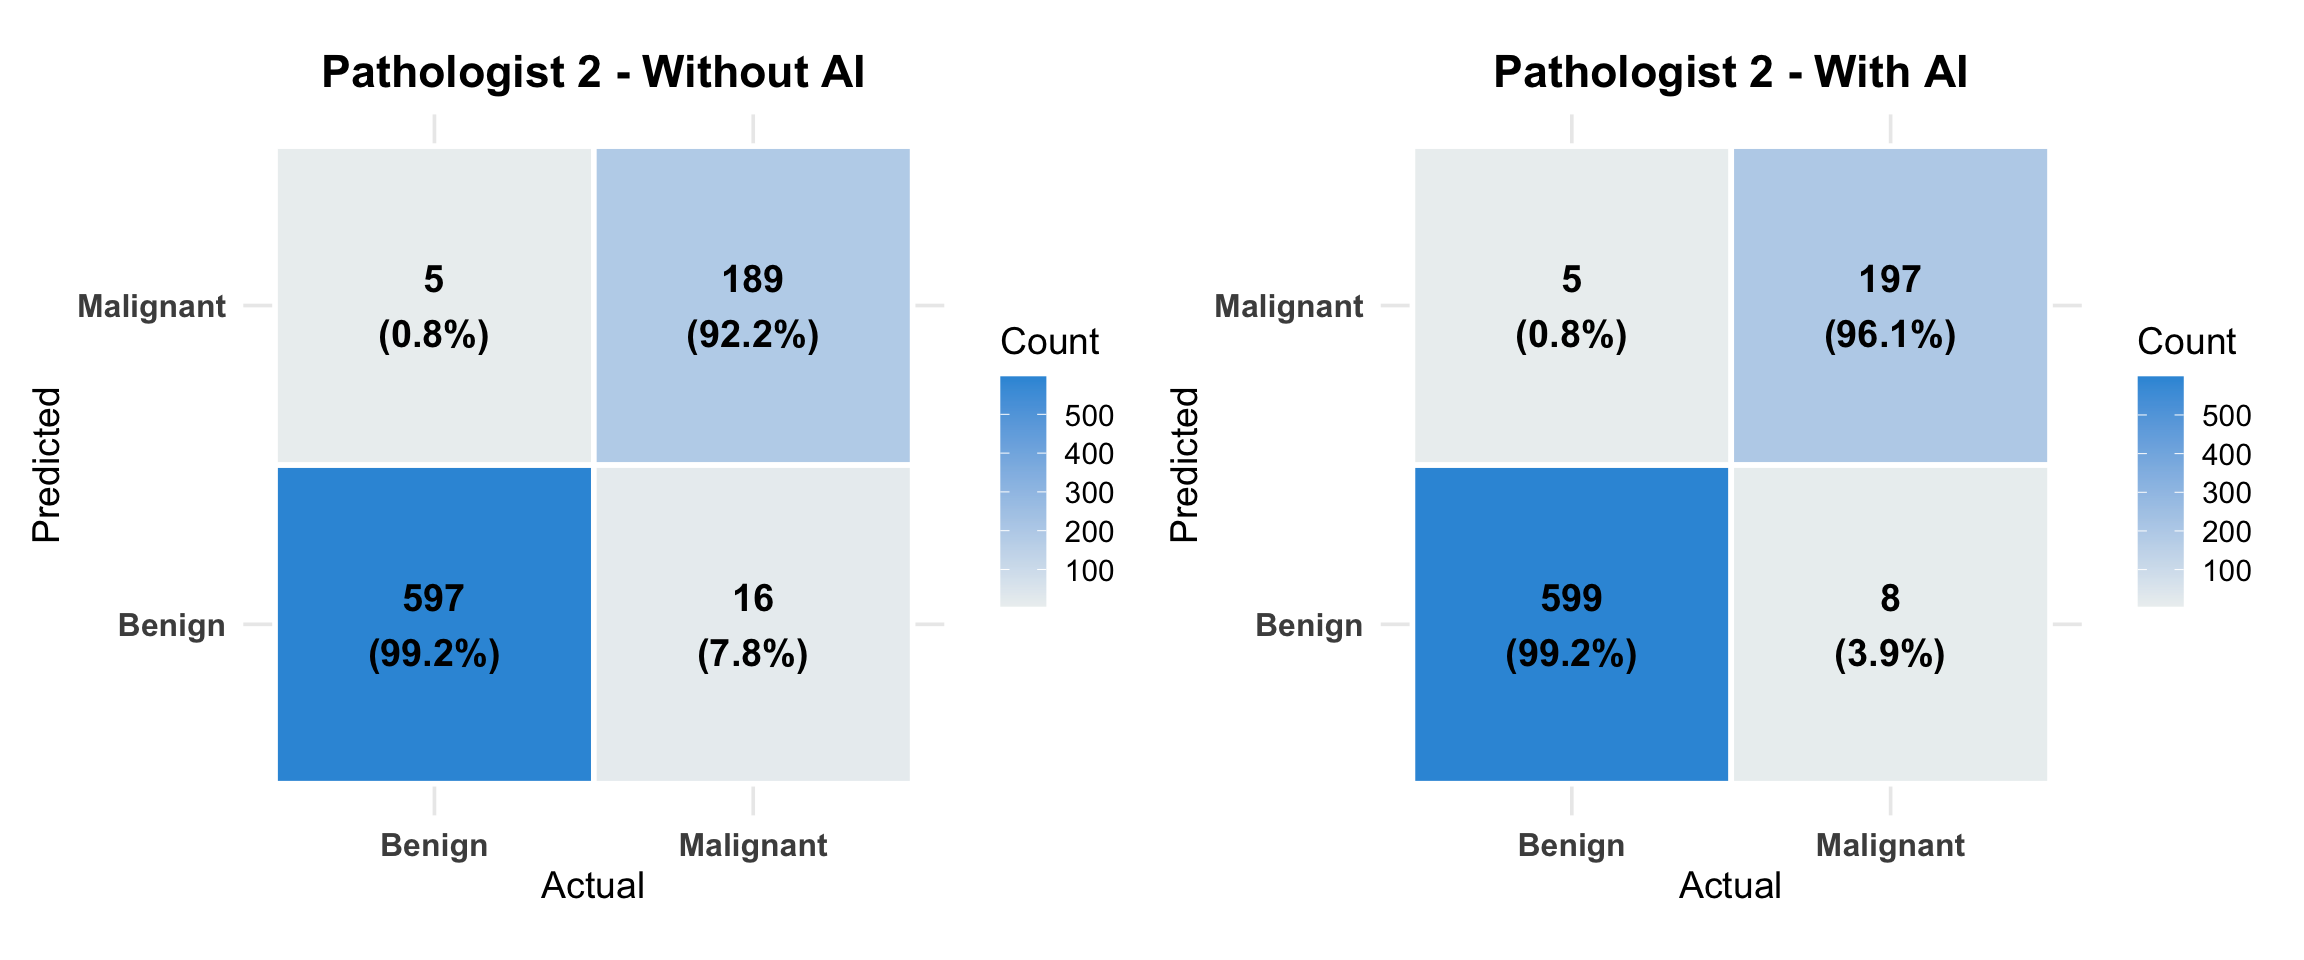
6.3.2 Pathologist 2
6.3.3 Pathologist 3
6.3.4 Pathologist 4
6.4 Statistical Significance of Performance Changes
McNemar’s Test for Diagnostic Changes
Testing whether the changes in diagnostic accuracy with AI are statistically significant using McNemar’s test for paired data.
6.4.1 McNemar’s Tests for Diagnostic Changes
Note for Pathologists: Statistical tests (McNemar’s) to determine if the changes in diagnosis (from correct to incorrect, or vice versa) are statistically significant.
6.4.1.1 P1
Contingency Table:
| 0 | 1 | |
|---|---|---|
| 0 | 607 | 17 |
| 1 | 4 | 180 |
McNemar Chi-squared: 6.857 p-value: 0.00883 Discordant pairs: 21 Changed to Malignant: 17 Changed to Benign: 4
6.4.1.2 P2
Contingency Table:
| 0 | 1 | |
|---|---|---|
| 0 | 605 | 10 |
| 1 | 2 | 192 |
McNemar Chi-squared: 4.083 p-value: 0.0433 Discordant pairs: 12 Changed to Malignant: 10 Changed to Benign: 2
6.4.1.3 P3
Contingency Table:
| 0 | 1 | |
|---|---|---|
| 0 | 612 | 22 |
| 1 | 4 | 172 |
McNemar Chi-squared: 11.115 p-value: 0.000856 Discordant pairs: 26 Changed to Malignant: 22 Changed to Benign: 4
6.4.1.4 P4
Contingency Table:
| 0 | 1 | |
|---|---|---|
| 0 | 599 | 10 |
| 1 | 10 | 190 |
McNemar Chi-squared: 0 p-value: 1 Discordant pairs: 20 Changed to Malignant: 10 Changed to Benign: 10
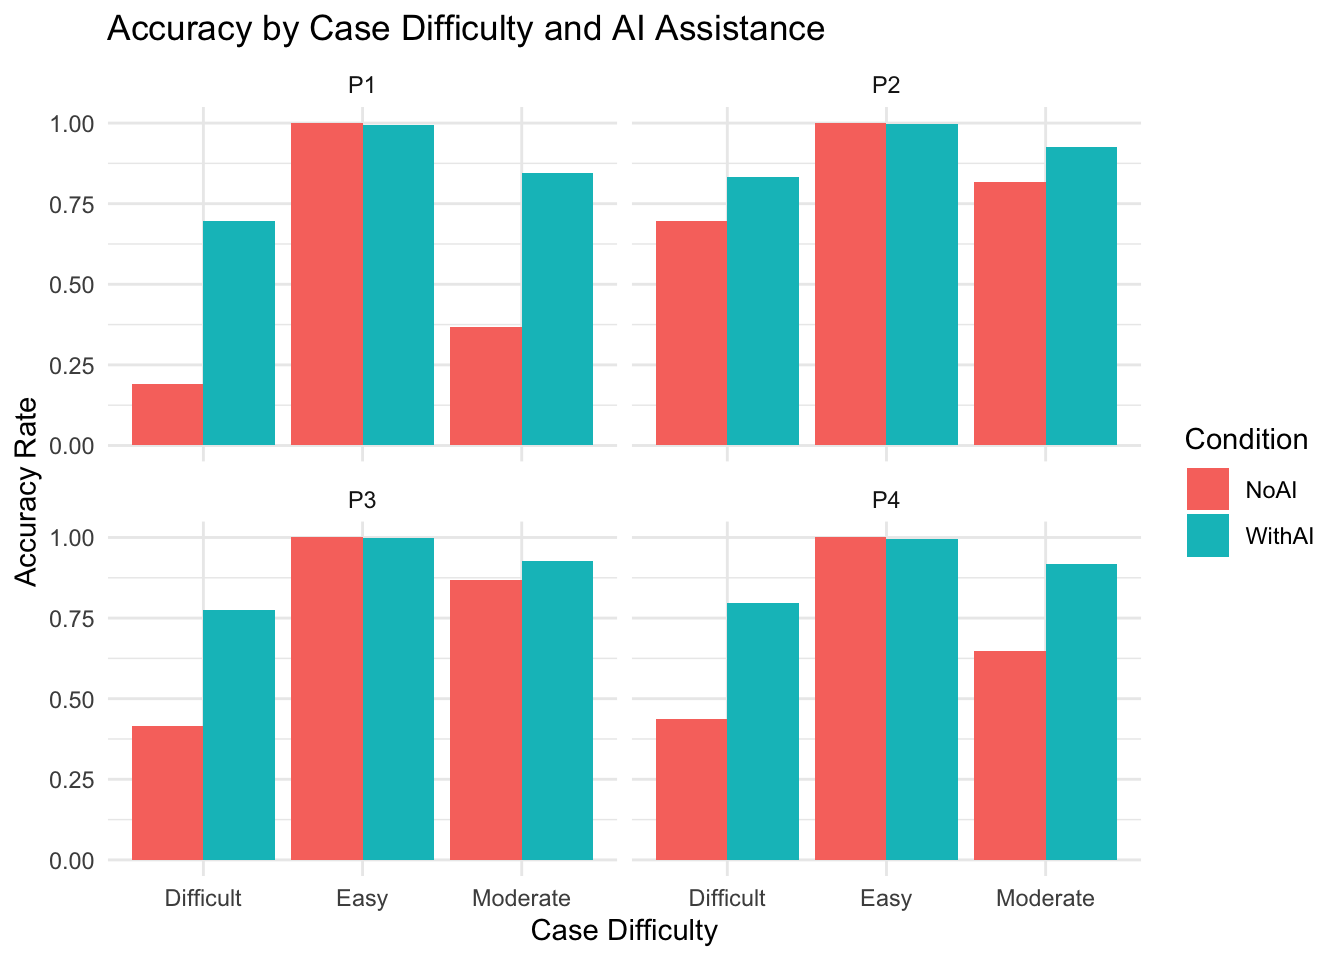
6.5 Accuracy by Case Difficulty
This section analyzes whether the “Difficulty” of a case (as subjectively rated or defined) impacts the accuracy of the diagnosis, and whether AI provides more benefit in difficult cases.
6.5.1 Accuracy Rates by Difficulty
We define “Accuracy” as agreement with the Reference Diagnosis (Research Diagnosis).
Note for Pathologists: Accuracy rates stratified by the difficulty of the cases (as defined by initial disagreement).
6.5.2 Visualization of AI Benefit
Does the improvement (With AI - No AI) depend on difficulty?
Note for Pathologists: Visualizing how accuracy varies with case difficulty and AI assistance.
This chapter provides comprehensive performance metrics for AI and pathologists, including sensitivity, specificity, PPV, NPV, ROC curves, and detailed confusion matrices.