 INTERRATER RELIABILITY

 Interrater Reliability
 ─────────────────────────────────────────────
                  Fleiss' Kappa for m Raters
 ─────────────────────────────────────────────
   Subjects                               60
   Raters                                  4
   Agreement %                      55.00000
   Kappa                           0.5416691
   z                                14.08069
   p-value        < .0000001
───────────────────────────────────────────── 20 Case Level
20.1 Diagnosis Case Level
20.1.1 Benign, Suspicious, Malignant, agreement among 4 pathologist, case level, noAI
Note for Pathologists: Inter-rater agreement among the 4 pathologists at the case level, WITHOUT AI assistance.
20.1.2 Benign, Suspicious, Malignant, agreement among 4 pathologist, case level, withAI
Note for Pathologists: Inter-rater agreement among the 4 pathologists at the case level, WITH AI assistance.
INTERRATER RELIABILITY
Interrater Reliability
─────────────────────────────────────────────
Fleiss' Kappa for m Raters
─────────────────────────────────────────────
Subjects 60
Raters 4
Agreement % 80.00000
Kappa 0.7983975
z 18.24460
p-value < .0000001
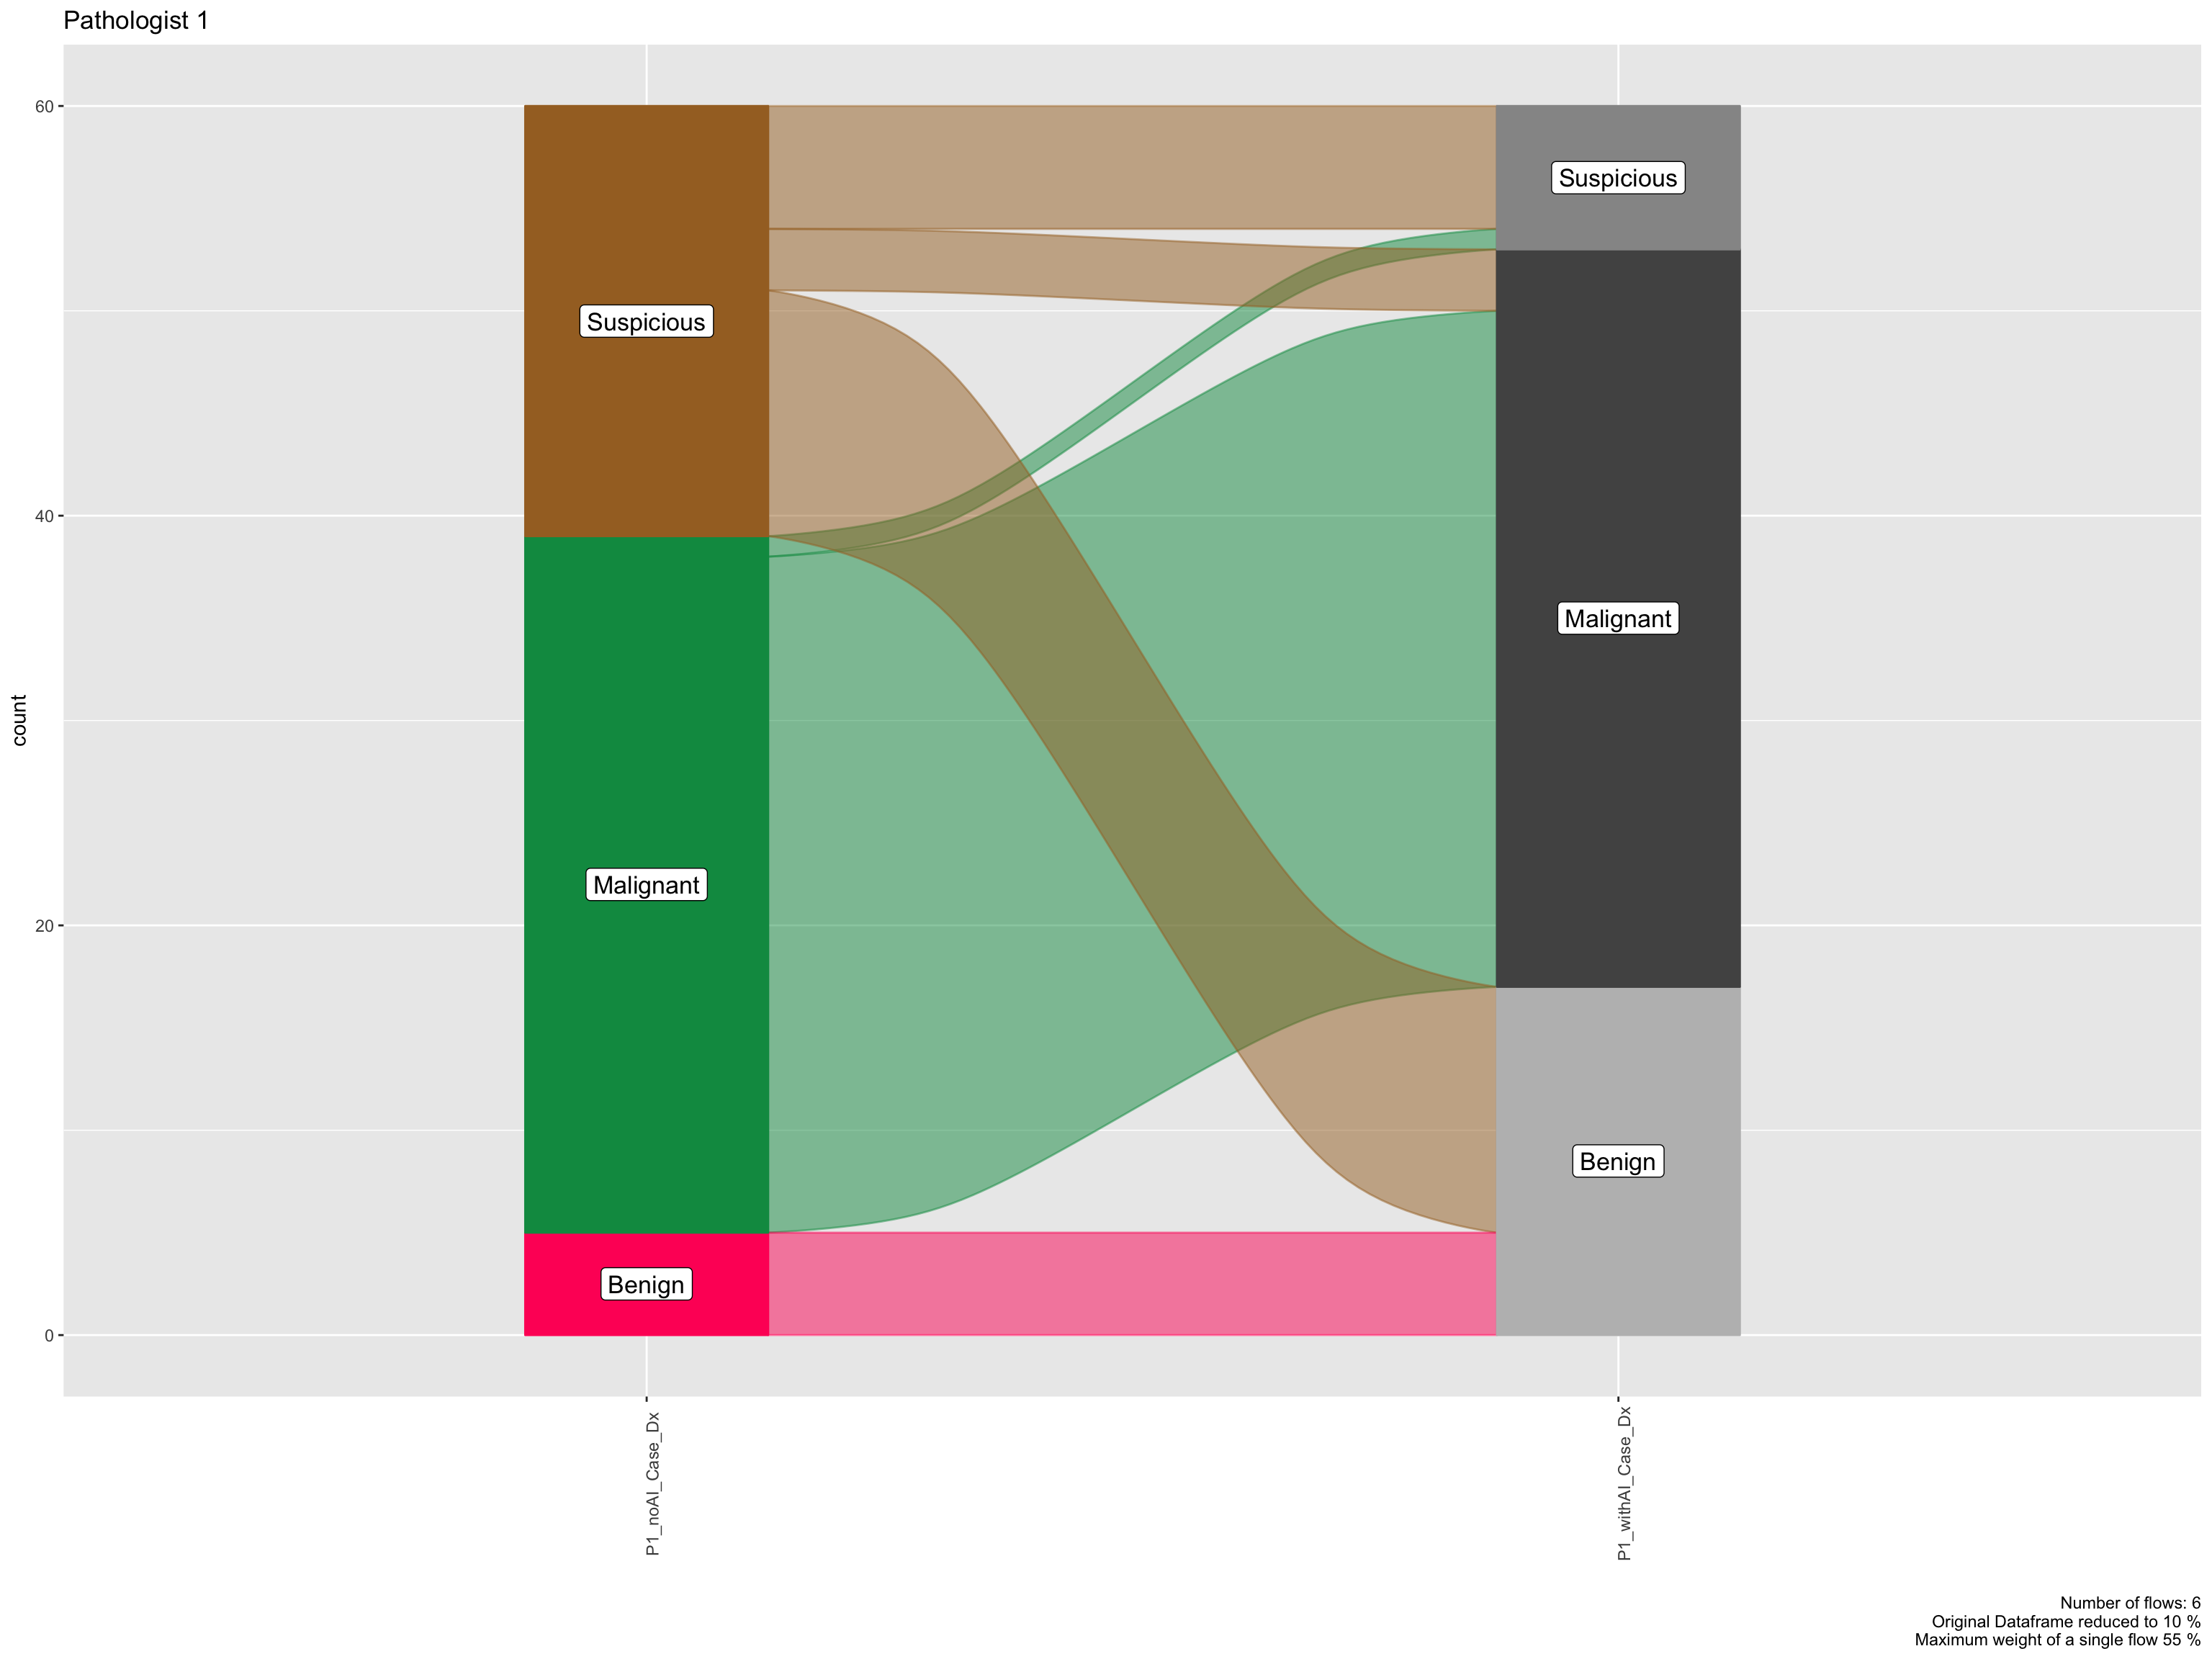
───────────────────────────────────────────── 20.1.3 Pathologist 1, case level, noAI vs withAI
Note for Pathologists: Comparing Pathologist 1’s diagnoses between no-AI and with-AI modes at the case level.
AI
|
Total | ||
|---|---|---|---|
| noAI | withAI | ||
| Diagnosis | |||
| Benign | 5 (8.3%) | 17 (28%) | 22 (18%) |
| Malignant | 34 (57%) | 36 (60%) | 70 (58%) |
| Suspicious | 21 (35%) | 7 (12%) | 28 (23%) |
| Total | 60 (100%) | 60 (100%) | 120 (100%) |
Note for Pathologists: Alluvial plot showing how Pathologist 1’s diagnoses shifted (or stayed the same) when using AI.
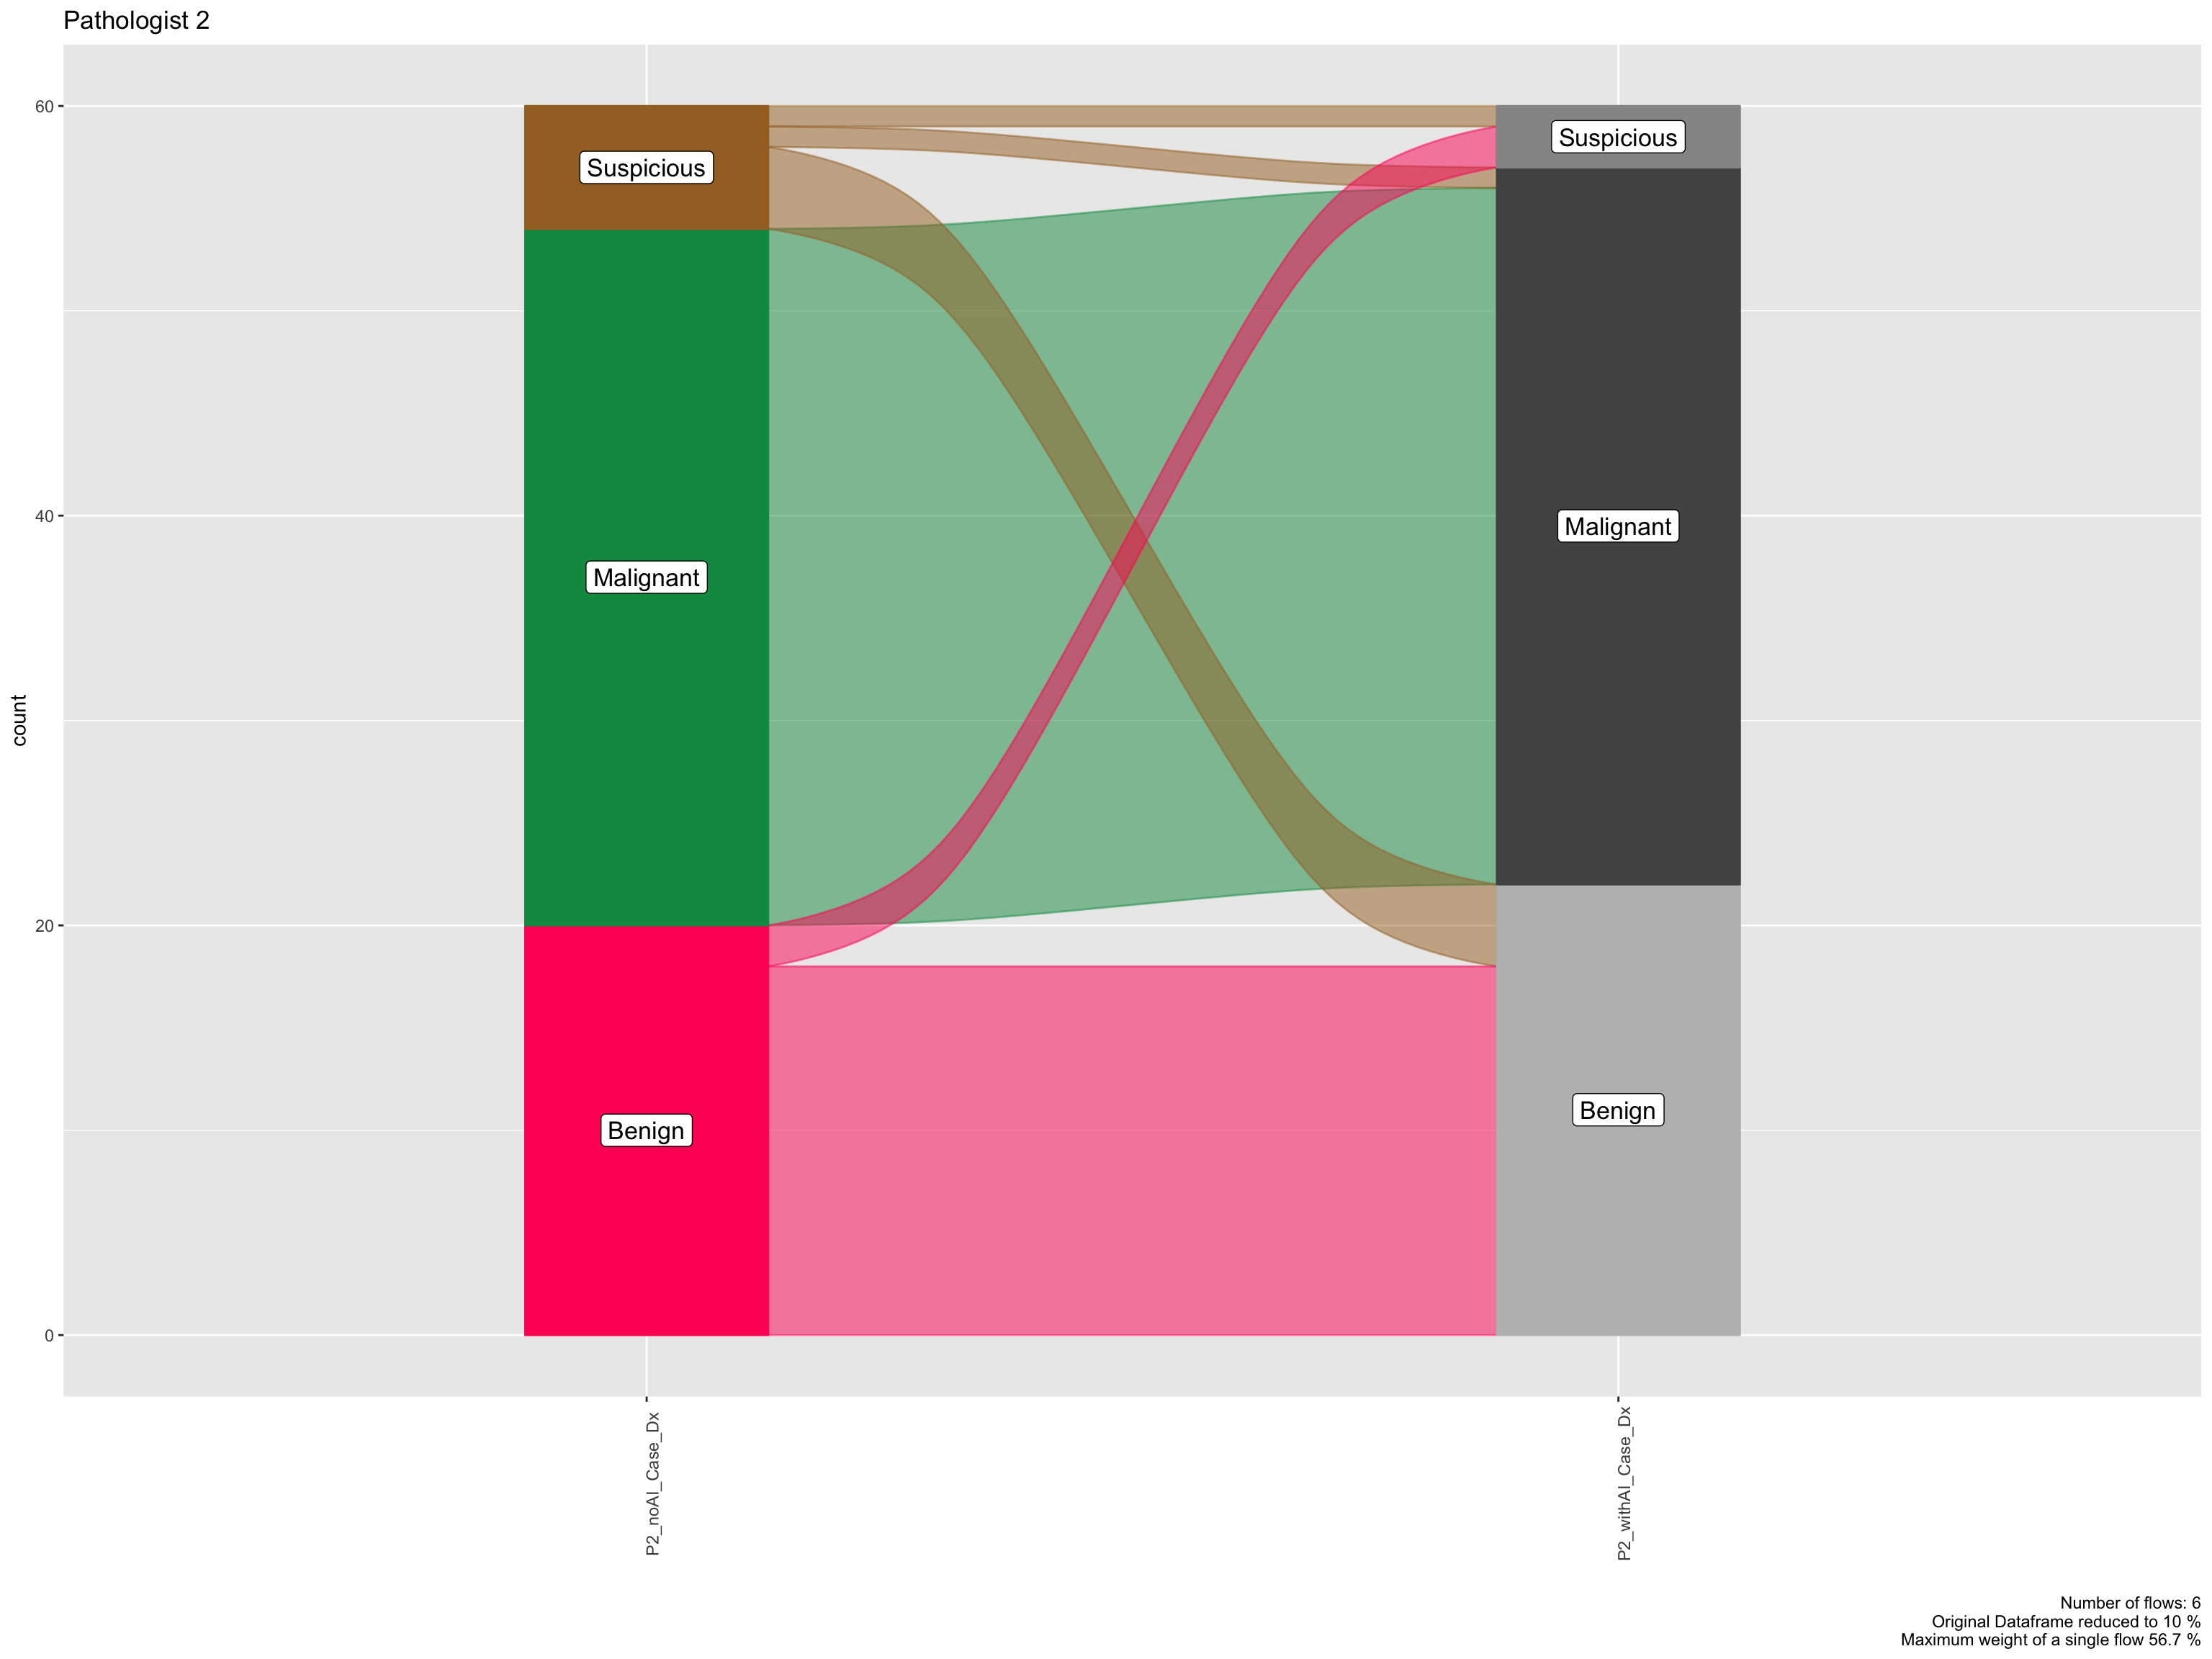
20.1.4 Pathologist 2, case level, noAI vs withAI
Note for Pathologists: Comparing Pathologist 2’s diagnoses between no-AI and with-AI modes at the case level.
AI
|
Total | ||
|---|---|---|---|
| noAI | withAI | ||
| Diagnosis | |||
| Benign | 20 (33%) | 22 (37%) | 42 (35%) |
| Malignant | 34 (57%) | 35 (58%) | 69 (58%) |
| Suspicious | 6 (10%) | 3 (5.0%) | 9 (7.5%) |
| Total | 60 (100%) | 60 (100%) | 120 (100%) |
Note for Pathologists: Alluvial plot showing how Pathologist 2’s diagnoses shifted when using AI.
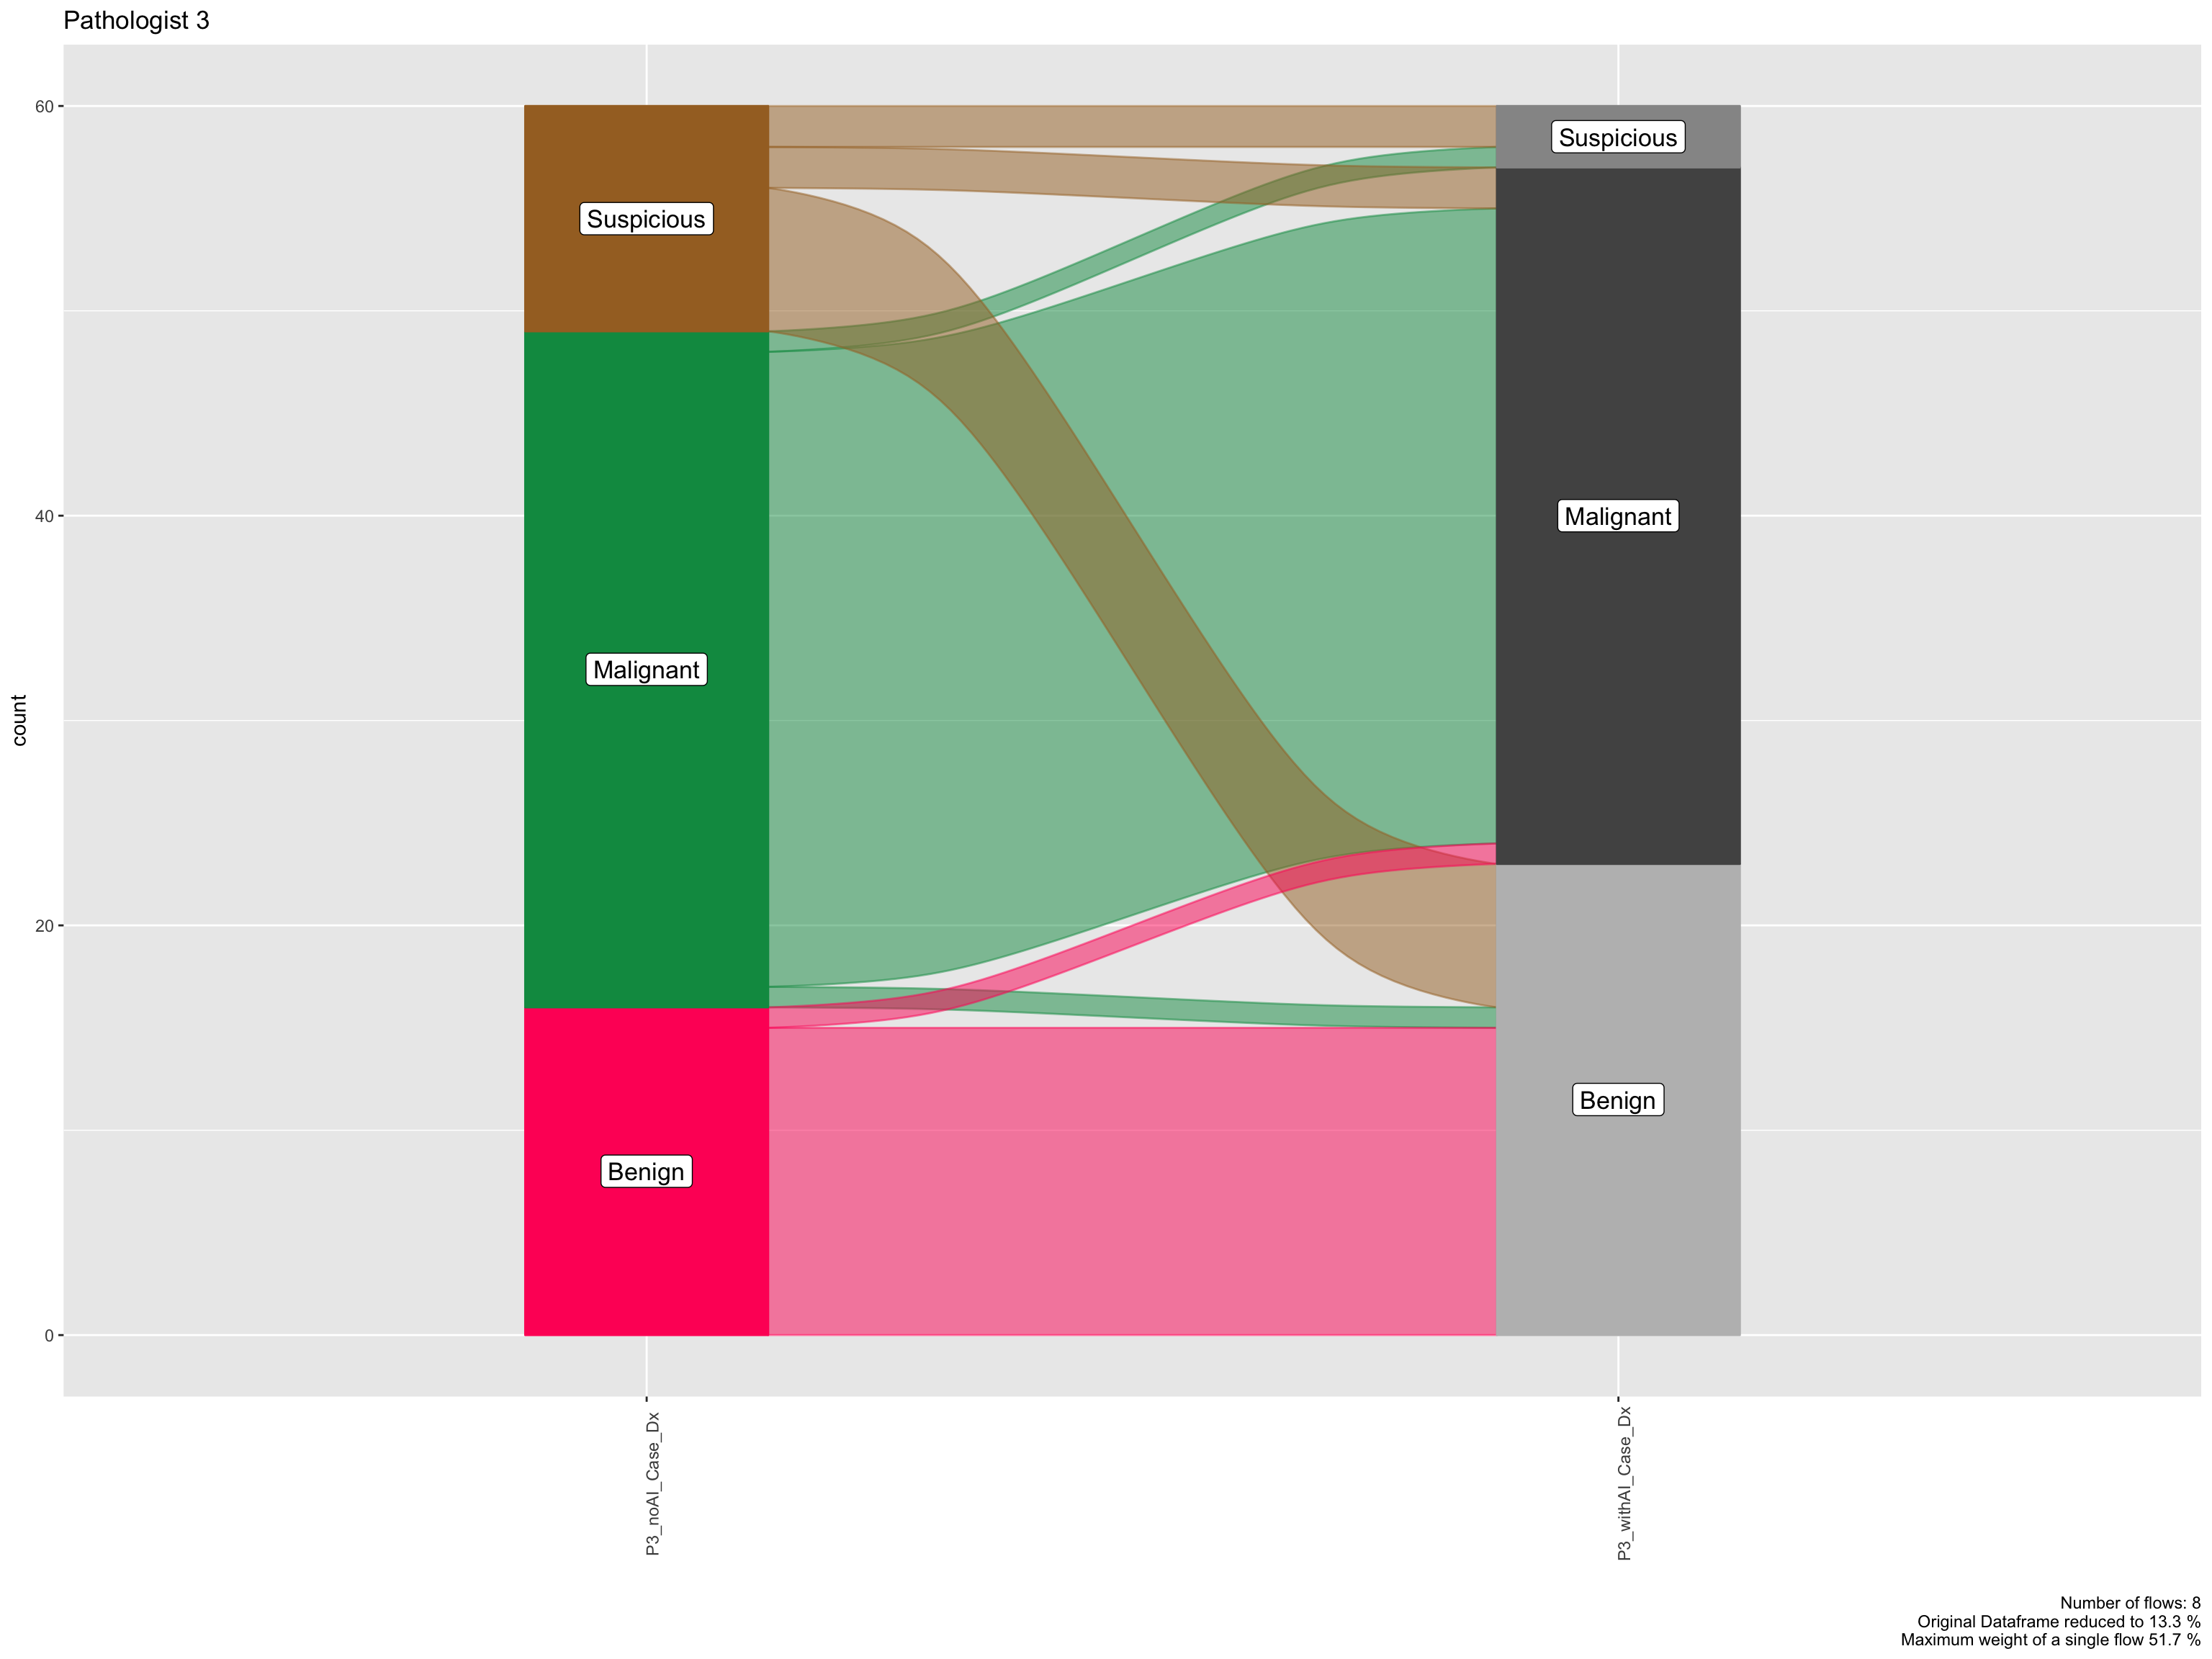
20.1.5 Pathologist 3, case level, noAI vs withAI
Note for Pathologists: Comparing Pathologist 3’s diagnoses between no-AI and with-AI modes at the case level.
AI
|
Total | ||
|---|---|---|---|
| noAI | withAI | ||
| Diagnosis | |||
| Benign | 16 (27%) | 23 (38%) | 39 (33%) |
| Malignant | 33 (55%) | 34 (57%) | 67 (56%) |
| Suspicious | 11 (18%) | 3 (5.0%) | 14 (12%) |
| Total | 60 (100%) | 60 (100%) | 120 (100%) |
Note for Pathologists: Alluvial plot showing how Pathologist 3’s diagnoses shifted when using AI.
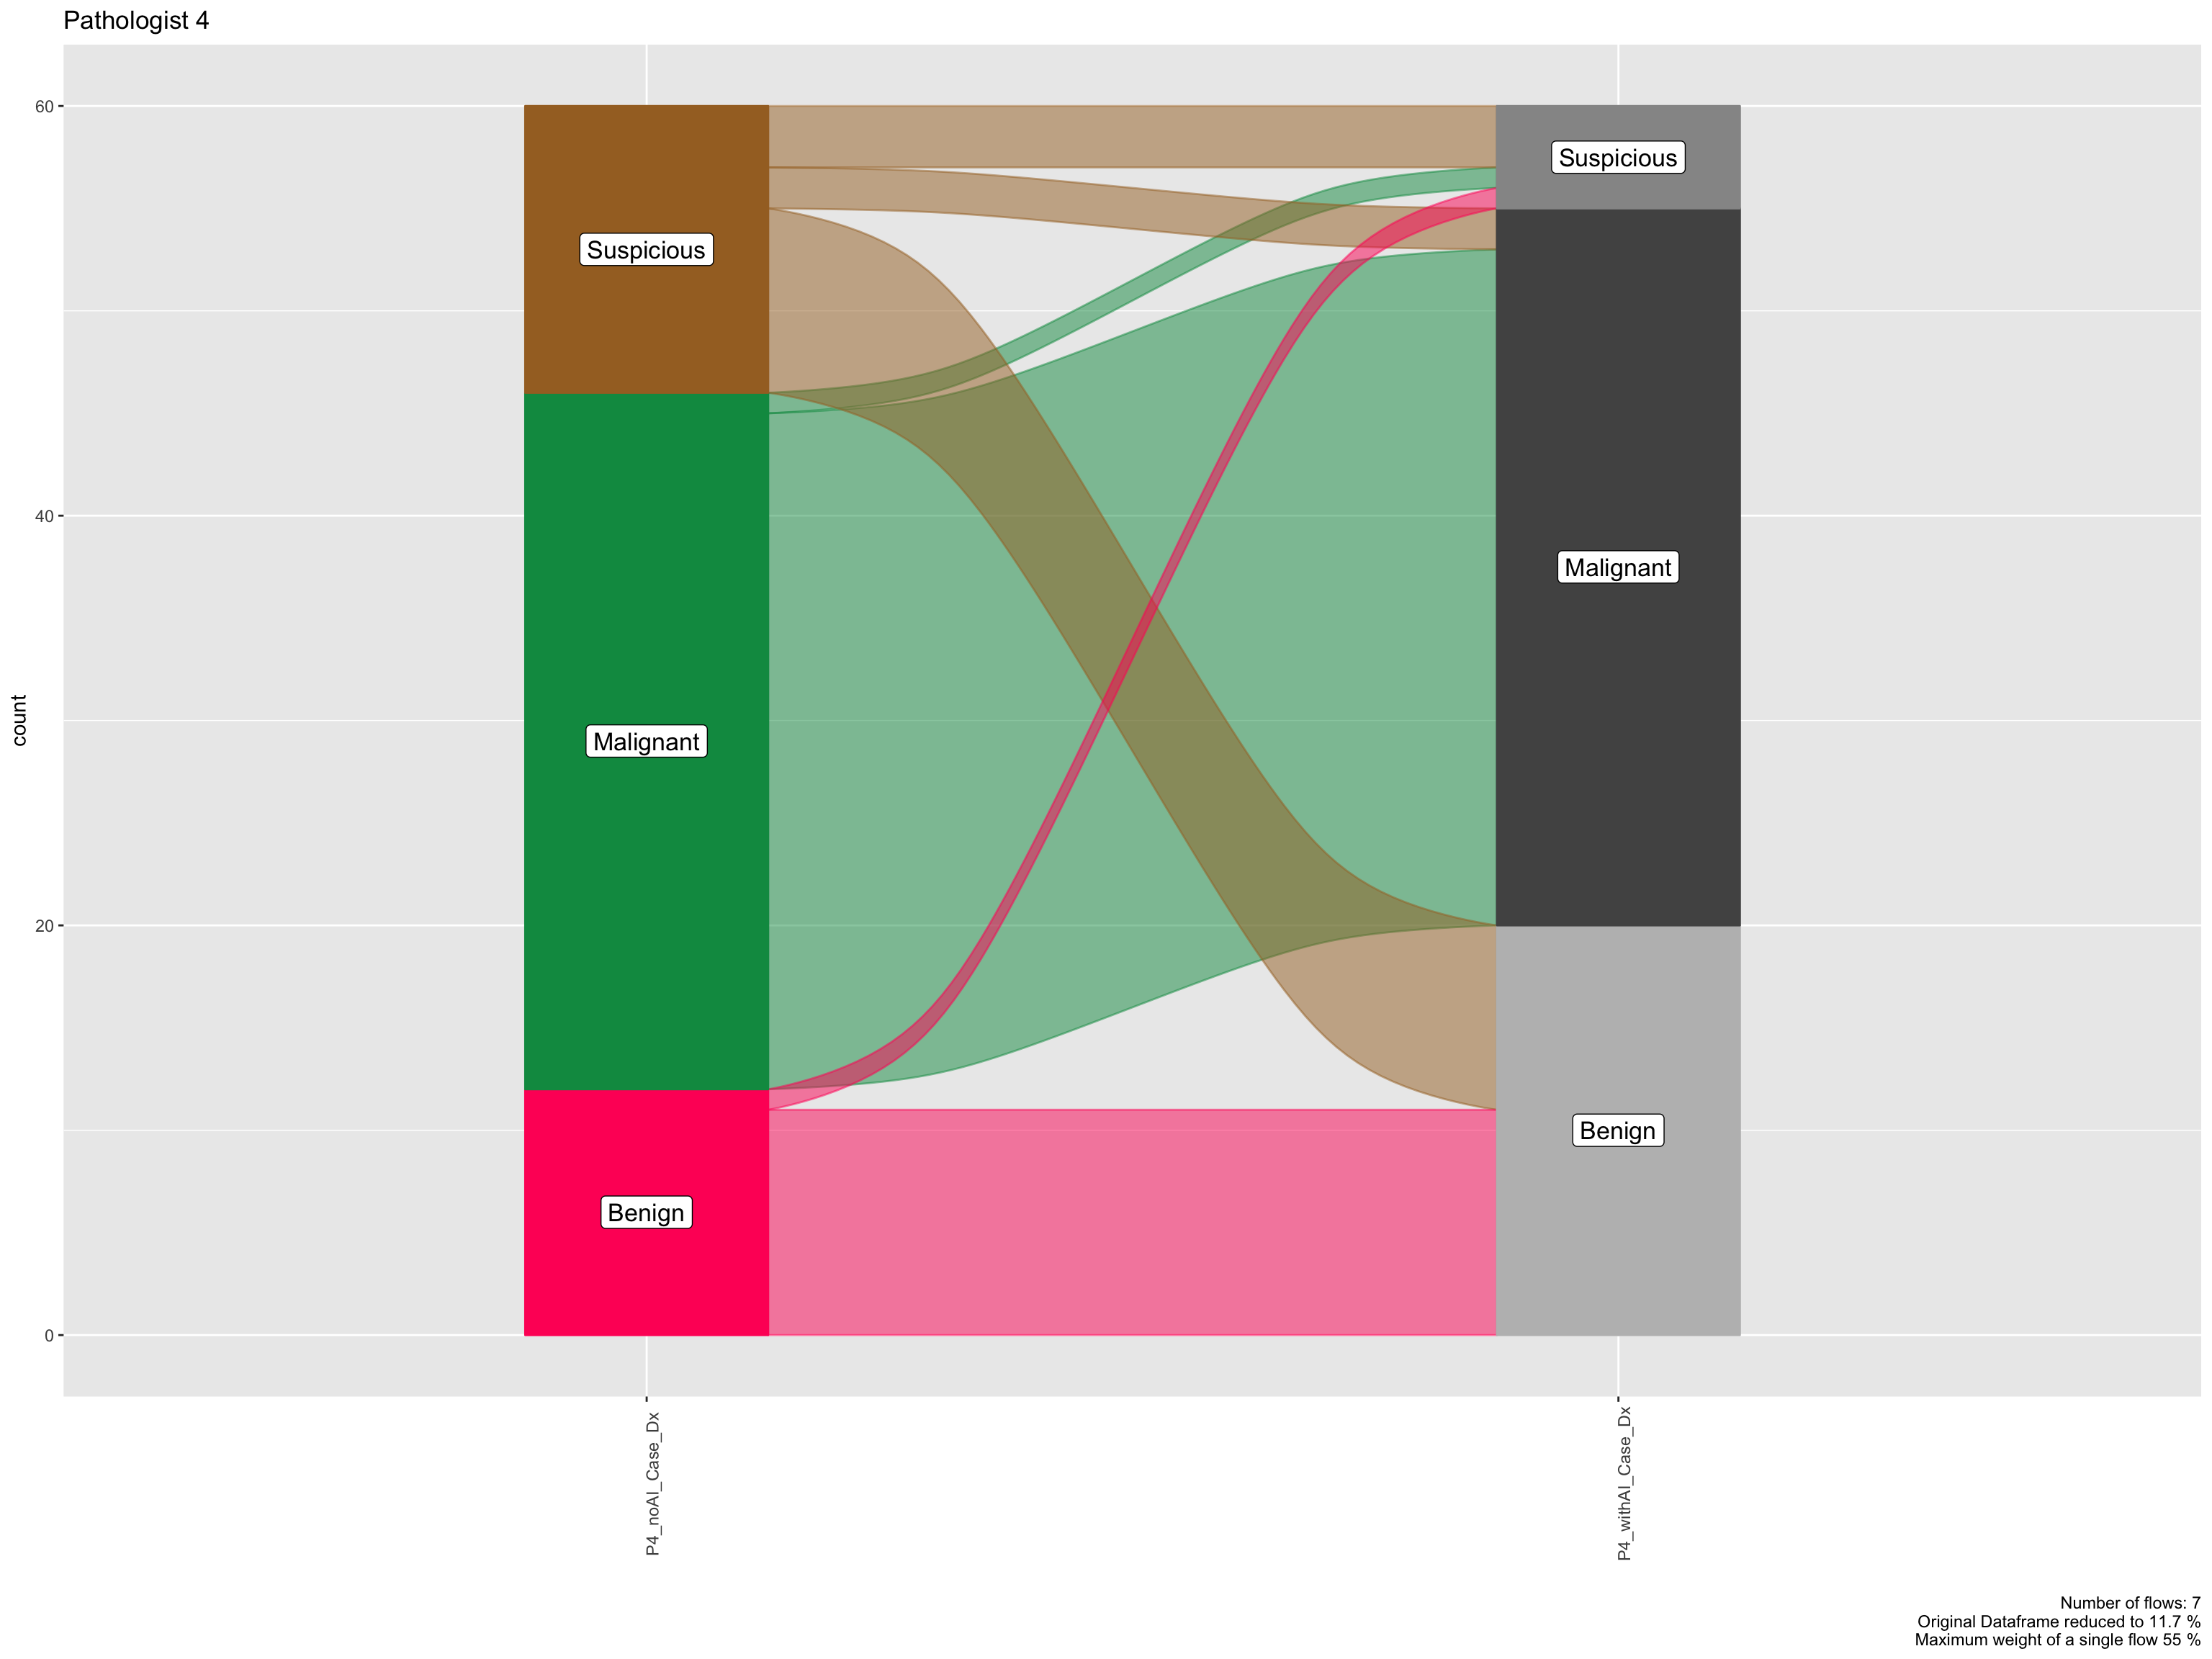
20.1.6 Pathologist 4, case level, noAI vs withAI
Note for Pathologists: Comparing Pathologist 4’s diagnoses between no-AI and with-AI modes at the case level.
AI
|
Total | ||
|---|---|---|---|
| noAI | withAI | ||
| Diagnosis | |||
| Benign | 12 (20%) | 20 (33%) | 32 (27%) |
| Malignant | 34 (57%) | 35 (58%) | 69 (58%) |
| Suspicious | 14 (23%) | 5 (8.3%) | 19 (16%) |
| Total | 60 (100%) | 60 (100%) | 120 (100%) |
Note for Pathologists: Alluvial plot showing how Pathologist 4’s diagnoses shifted when using AI.
20.2 Durations Case Level
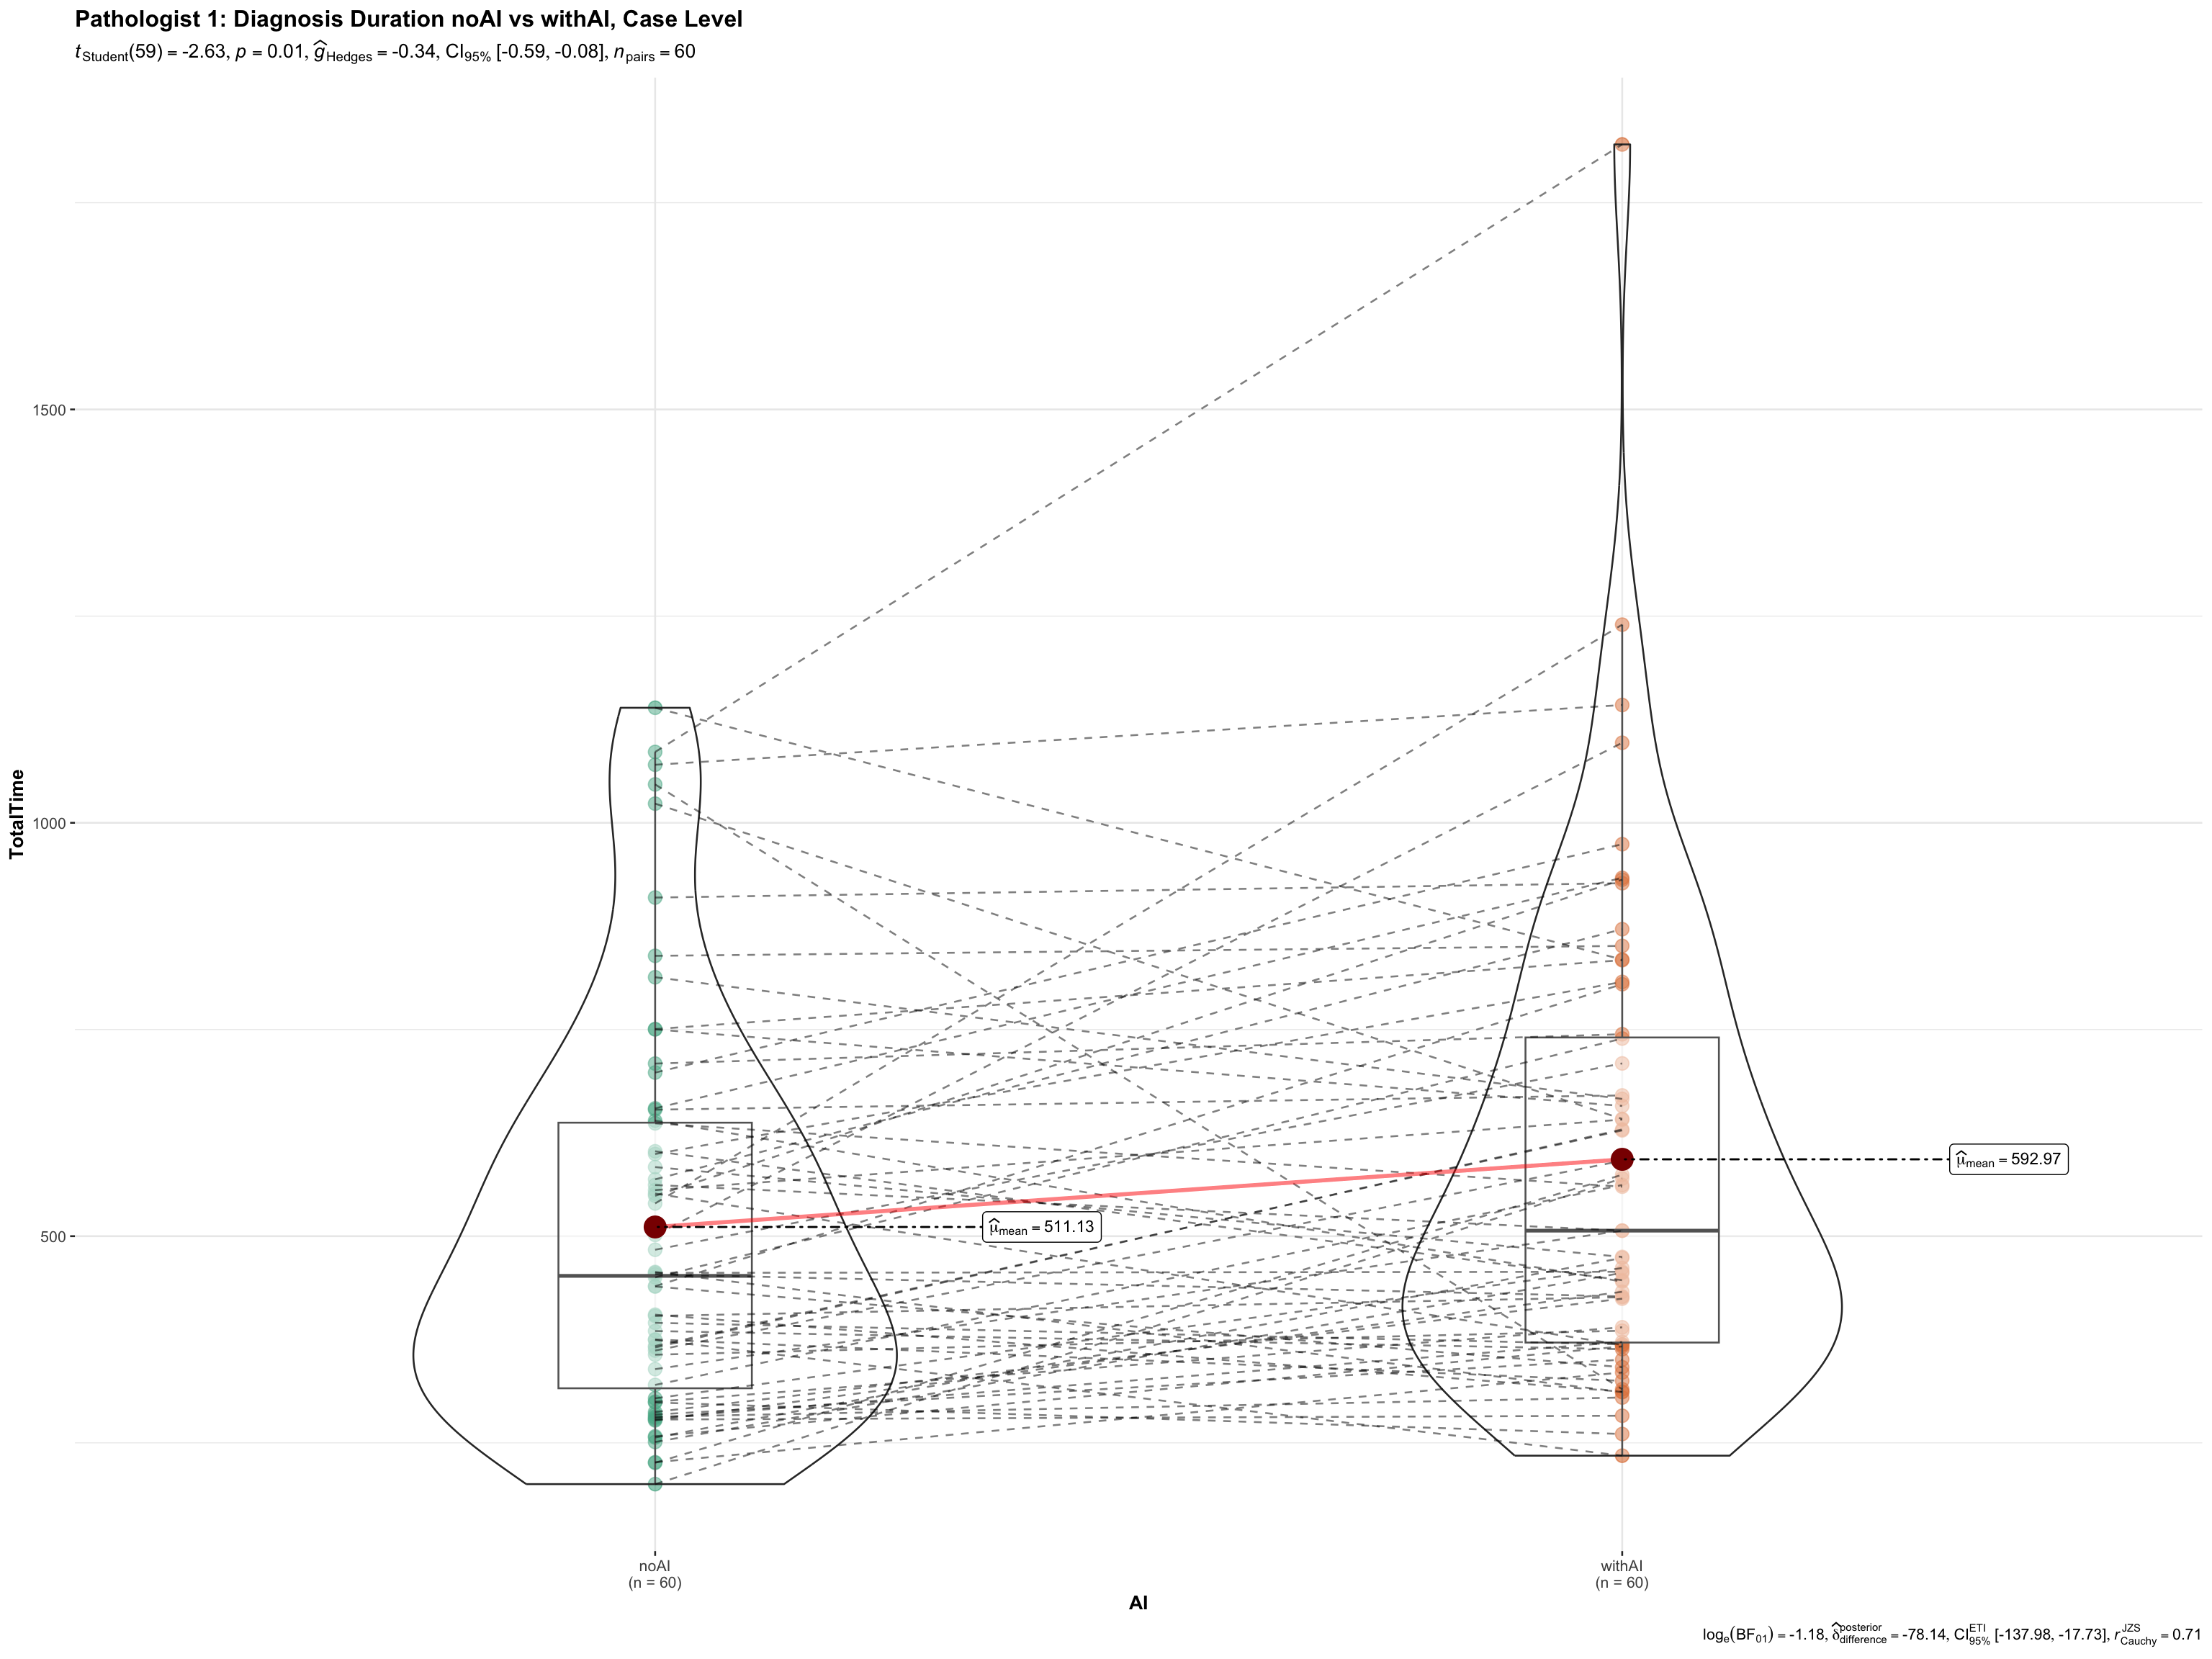
20.3 Pathologist 1 Duration, Case Level
Note for Pathologists: Descriptive statistics for Pathologist 1’s total case duration (sum of all cores) with vs. without AI.
 DESCRIPTIVES

 Descriptives
 ────────────────────────────────────────────────────────────────────
                         P1_noAI_total_time    P1_withAI_total_time
 ────────────────────────────────────────────────────────────────────
   N                                     60                      60
   Missing                                0                       0
   Mean                            511.1263                592.9698
   Median                          451.9945                506.6940
   Mode                            200.0950                234.5120
   Standard deviation              240.4353                288.3290
   Minimum                         200.0950                234.5120
   Maximum                         1139.152                1820.550
 ────────────────────────────────────────────────────────────────────
Note for Pathologists: Visual comparison (paired boxplot) of Pathologist 1’s case duration with vs. without AI.
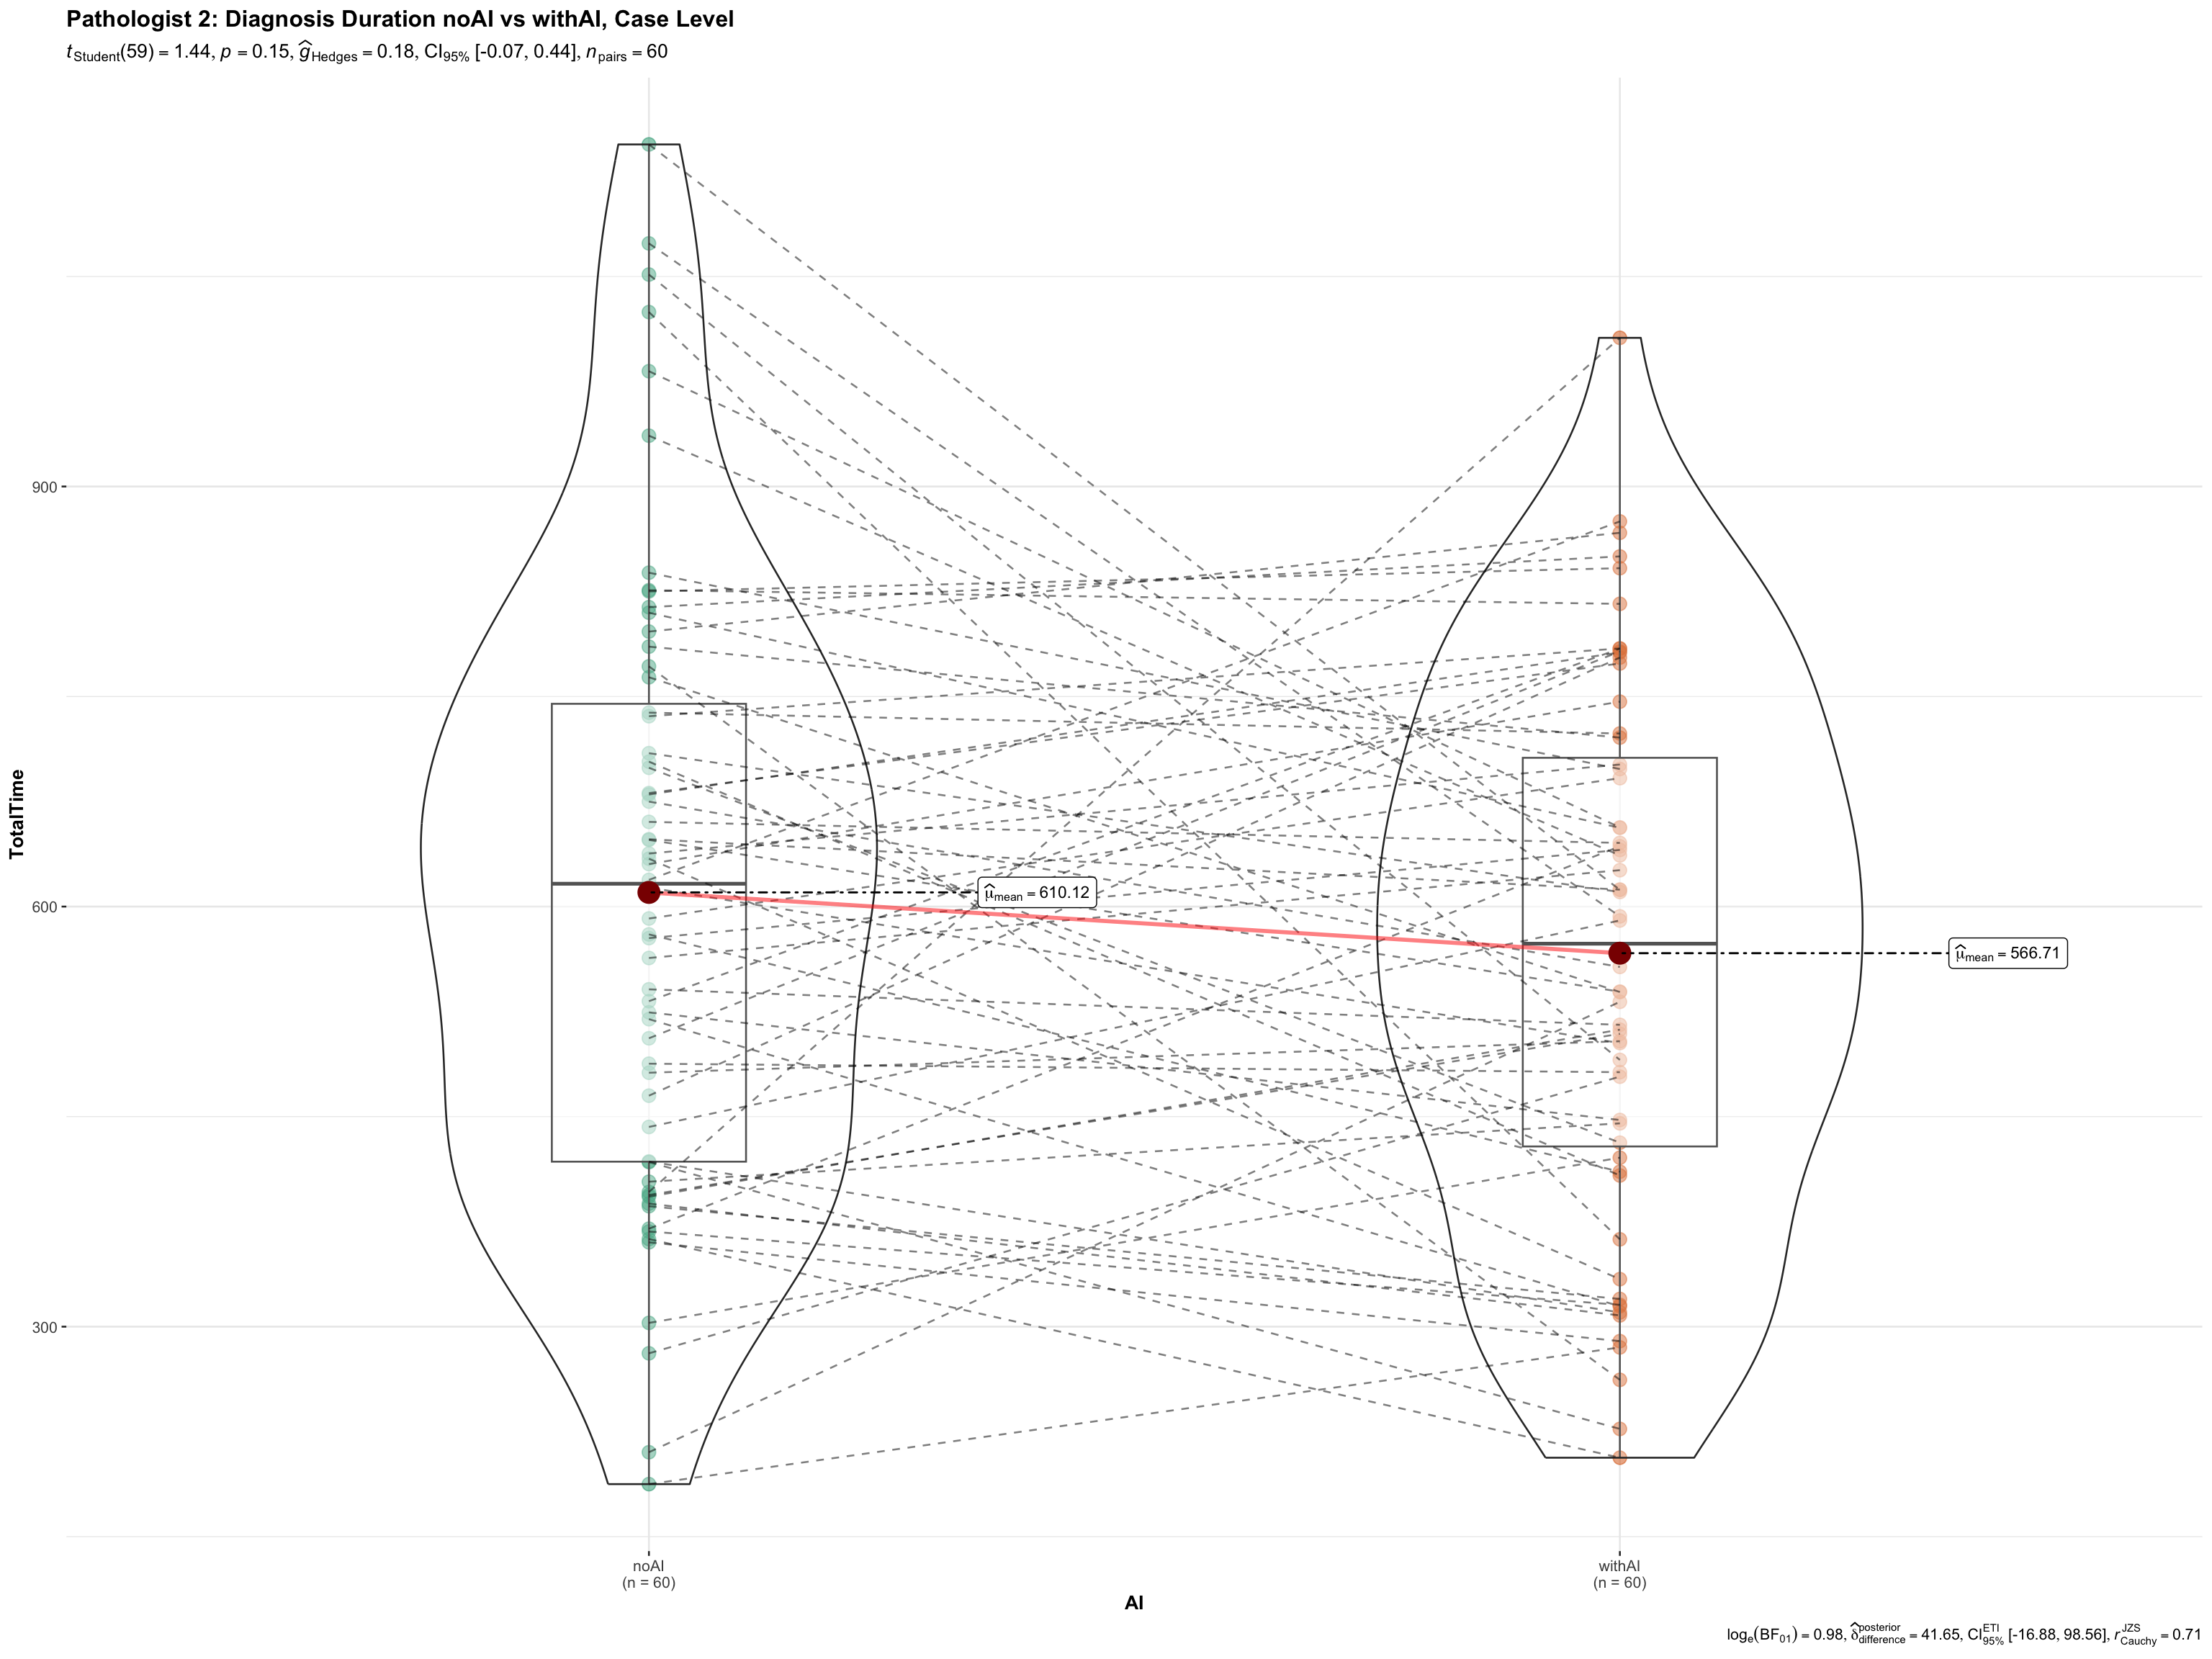
20.4 Pathologist 2 Duration, Case Level
Note for Pathologists: Descriptive statistics for Pathologist 2’s total case duration with vs. without AI.
 DESCRIPTIVES

 Descriptives
 ────────────────────────────────────────────────────────────────────
                         P2_noAI_total_time    P2_withAI_total_time
 ────────────────────────────────────────────────────────────────────
   N                                     60                      60
   Missing                                0                       0
   Mean                            610.1223                566.7121
   Median                          616.3115                573.4965
   Mode                            187.5500                206.4120
   Standard deviation              217.5722                189.6036
   Minimum                         187.5500                206.4120
   Maximum                         1144.285                1006.171
 ────────────────────────────────────────────────────────────────────
Note for Pathologists: Visual comparison (paired boxplot) of Pathologist 2’s case duration with vs. without AI.
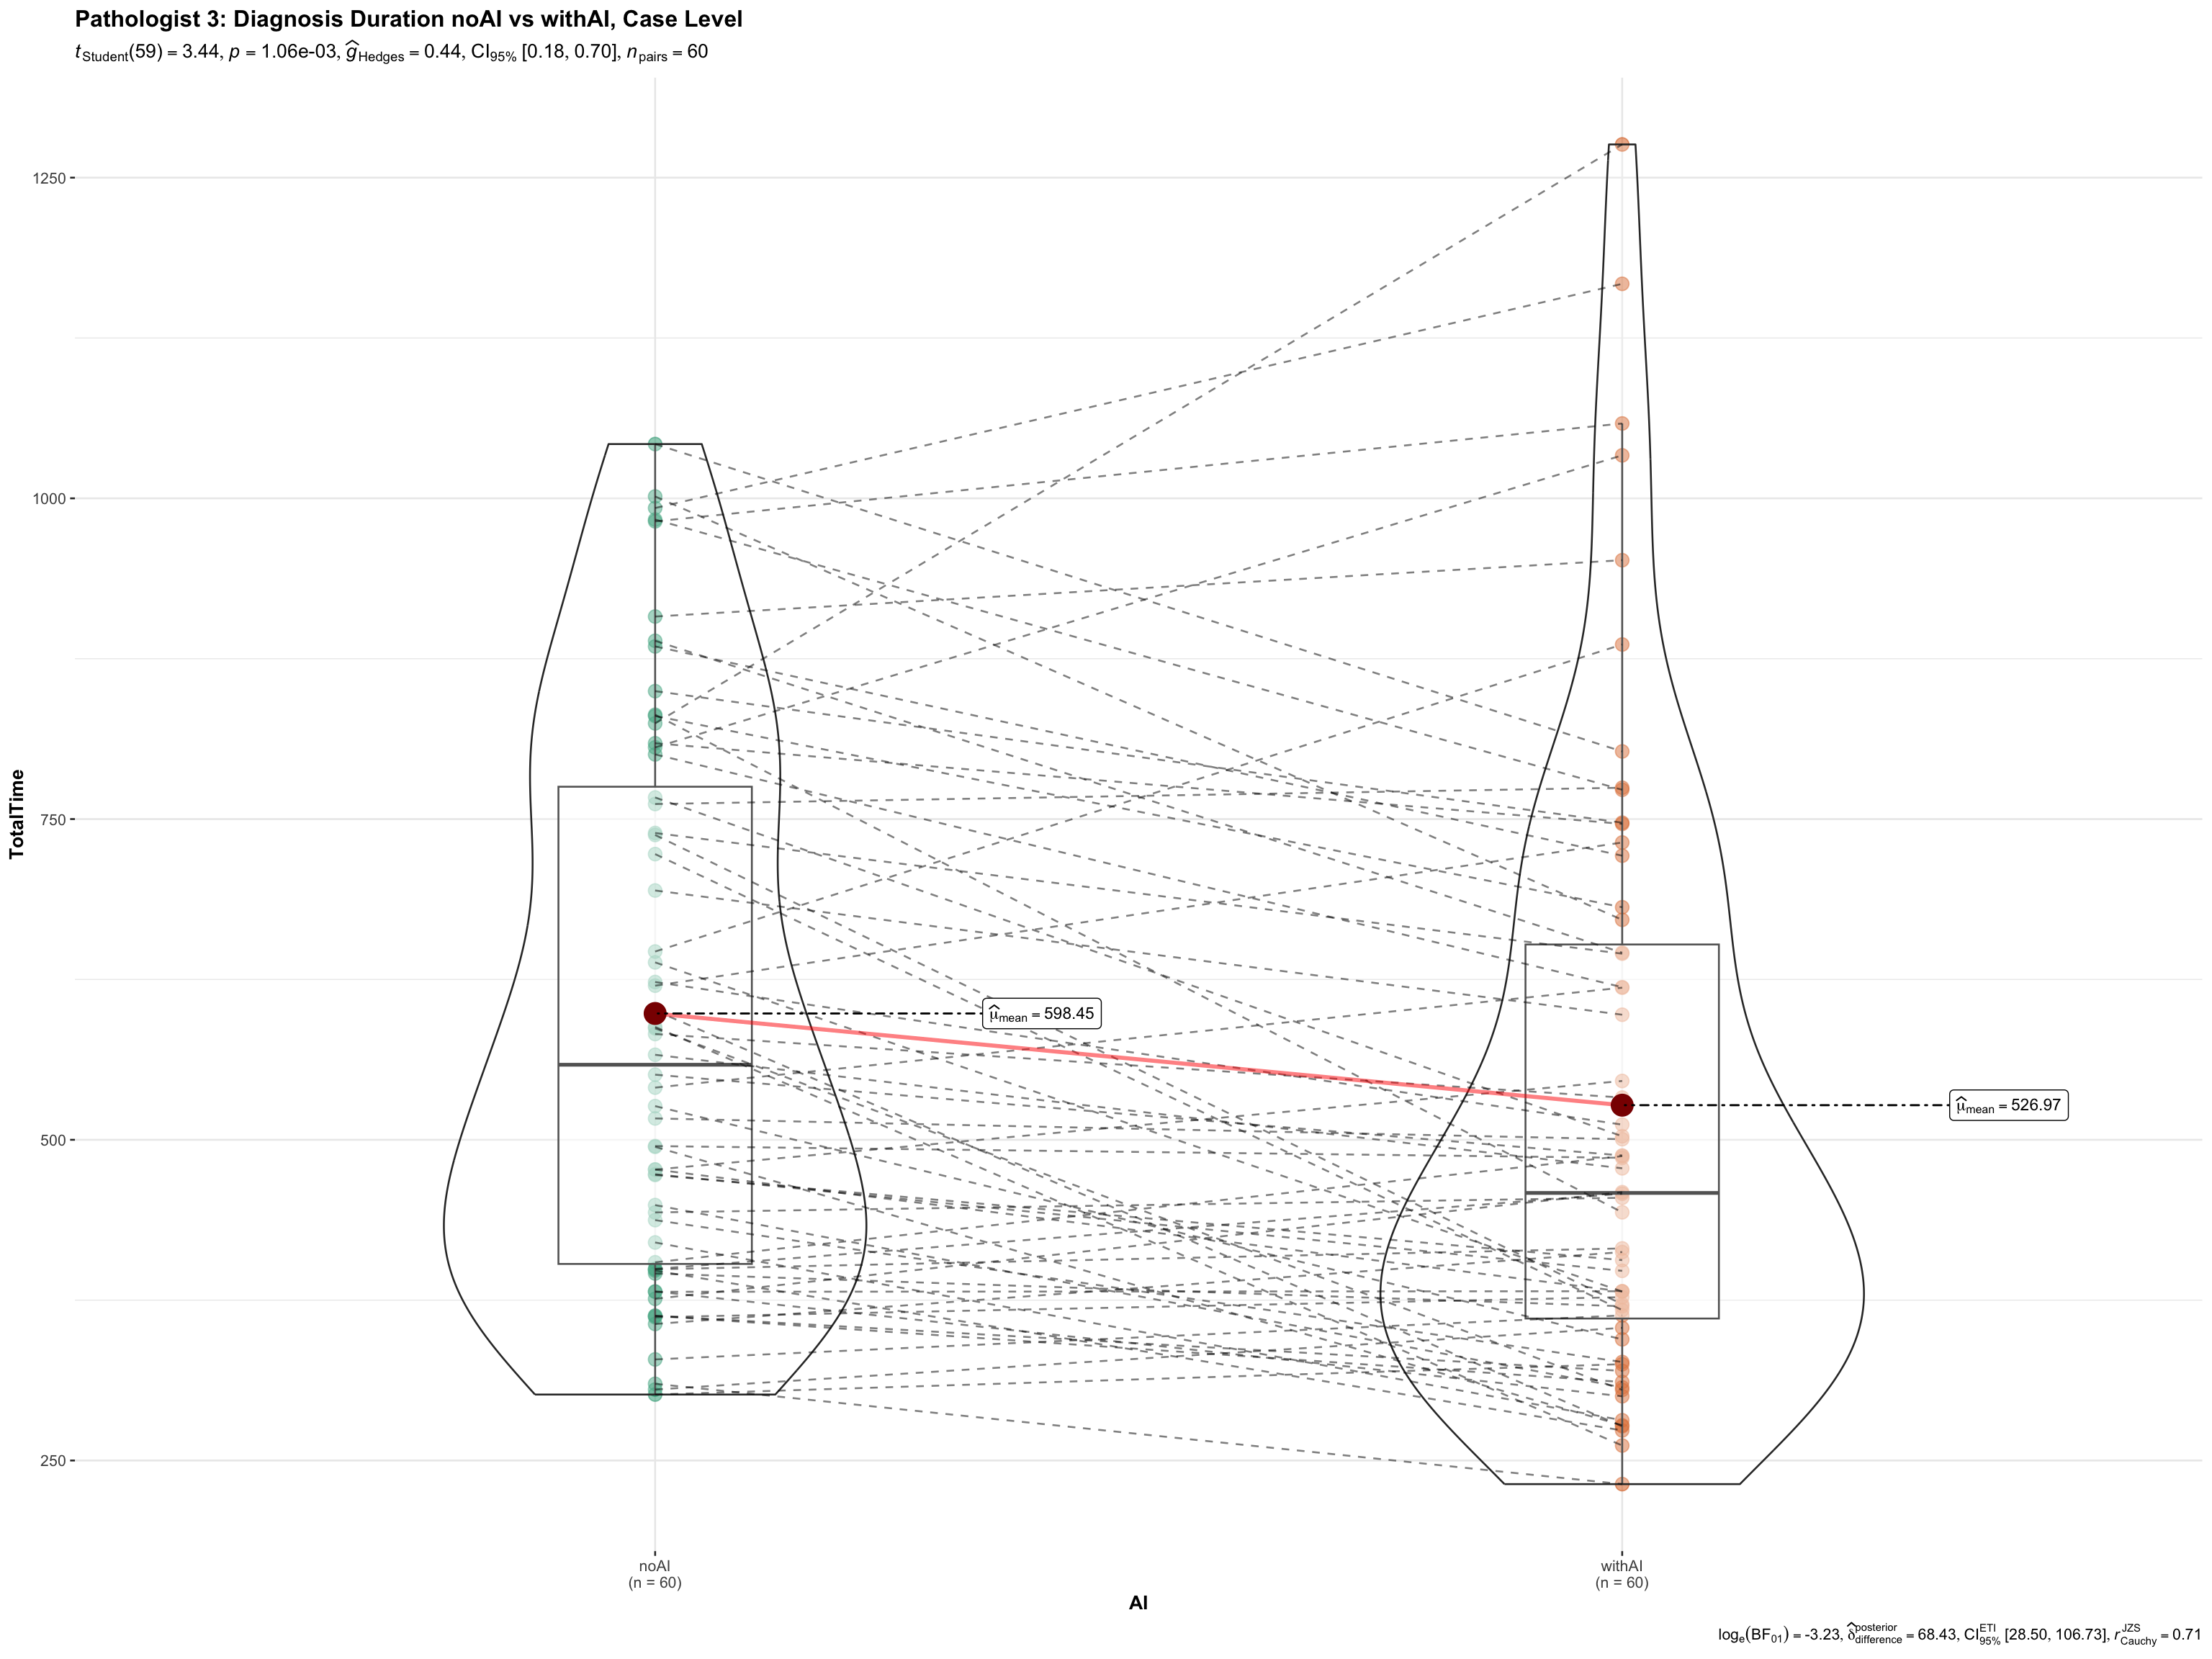
20.5 Pathologist 3 Duration, Case Level
Note for Pathologists: Descriptive statistics for Pathologist 3’s total case duration with vs. without AI.
 DESCRIPTIVES

 Descriptives
 ────────────────────────────────────────────────────────────────────
                         P3_noAI_total_time    P3_withAI_total_time
 ────────────────────────────────────────────────────────────────────
   N                                     60                      60
   Missing                                0                       0
   Mean                            598.4538                526.9725
   Median                          558.4995                458.5675
   Mode                            301.4210                231.5910
   Standard deviation              211.9250                238.3500
   Minimum                         301.4210                231.5910
   Maximum                         1042.310                1275.880
 ────────────────────────────────────────────────────────────────────
Note for Pathologists: Visual comparison (paired boxplot) of Pathologist 3’s case duration with vs. without AI.
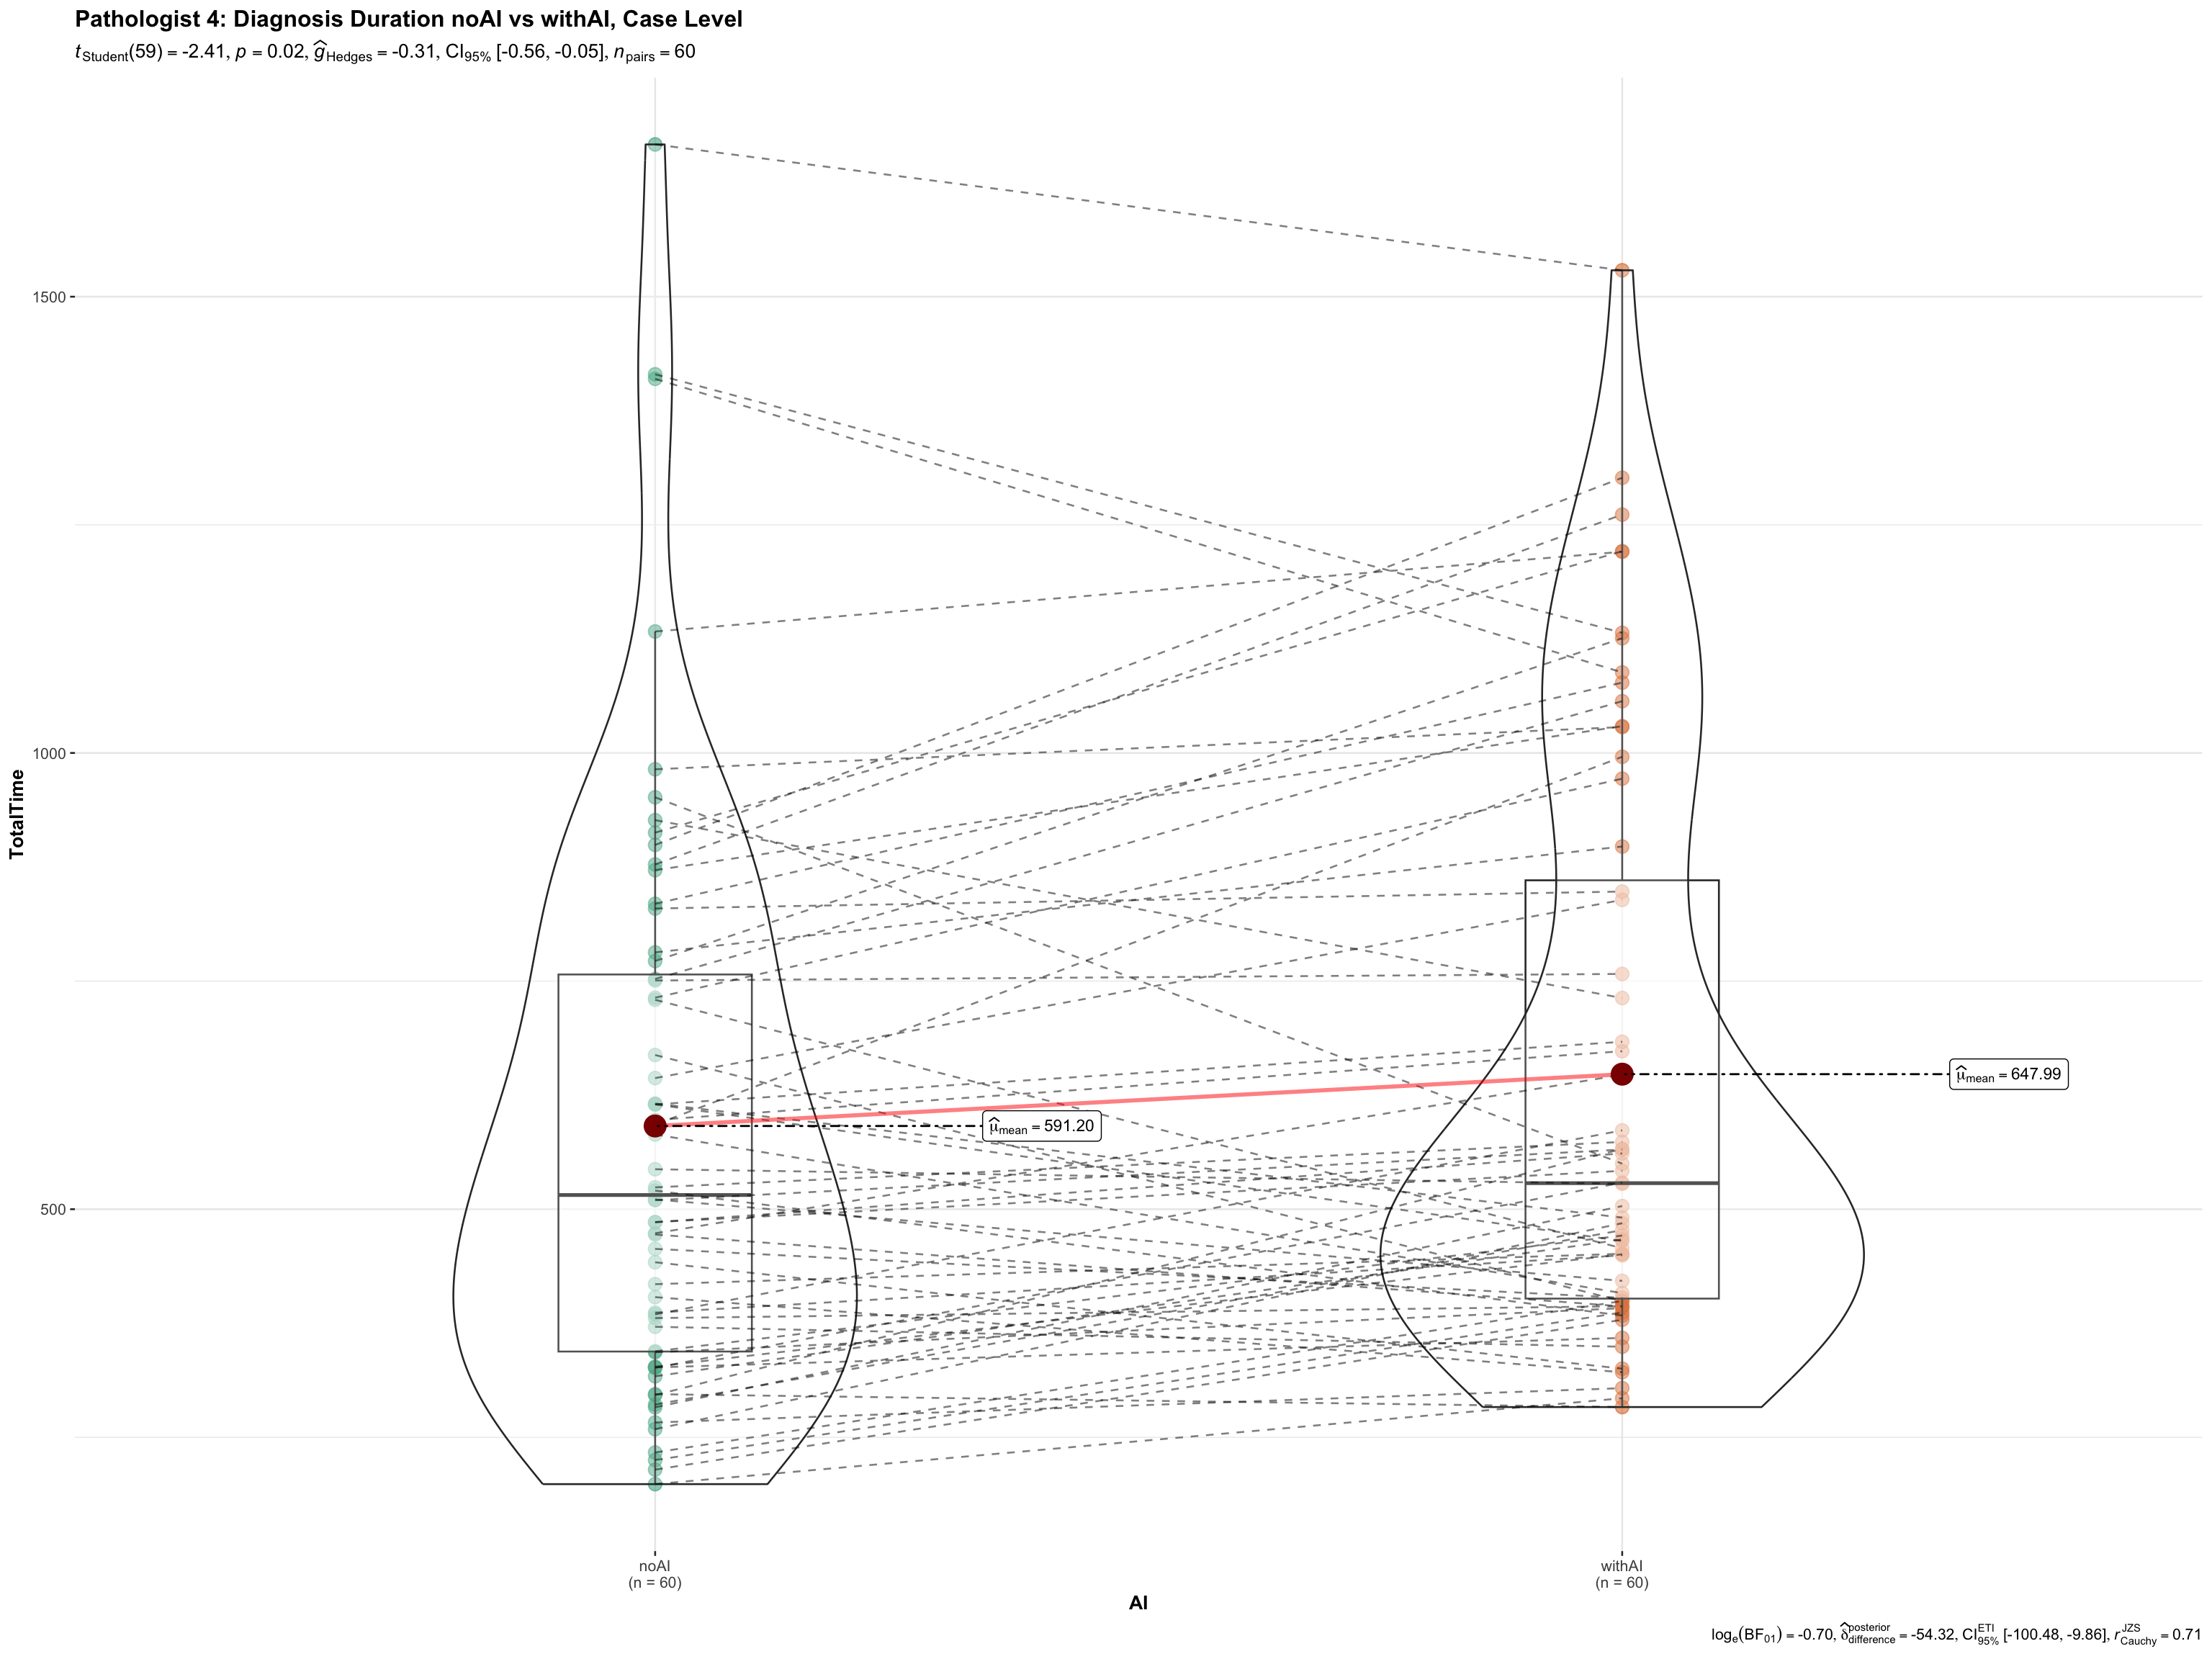
20.6 Pathologist 4 Duration, Case Level
Note for Pathologists: Descriptive statistics for Pathologist 4’s total case duration with vs. without AI.
 DESCRIPTIVES

 Descriptives
 ────────────────────────────────────────────────────────────────────
                         P4_noAI_total_time    P4_withAI_total_time
 ────────────────────────────────────────────────────────────────────
   N                                     60                      60
   Missing                                0                       0
   Mean                            591.2028                647.9873
   Median                          515.5540                528.5525
   Mode                            198.7370                283.1880
   Standard deviation              311.9181                313.8058
   Minimum                         198.7370                283.1880
   Maximum                         1666.866                1528.933
 ────────────────────────────────────────────────────────────────────